Skip Navigation Links www.nws.noaa.gov 
NOAA logo - Click to go to the NOAA home page National Weather Service   NWS logo - Click to go to the NWS home page
Climate Prediction Center
 

Climate Diagnostics Bulletin
Climate Diagnostics Bulletin - Home Climate Diagnostics Bulletin - Tropics Climate Diagnostics Bulletin - Extratropics


About the Forecast Forum

ENSO Forecast Discussion

ENSO and SST Model Forecasts

Canonical Correlation Model
Nino 3.4 Region: Historical  F1
Nino 3.4 Region: 0-4 Season  F2

NCEP Coupled Model
Eq. Pac. SST & Anomalies  F3
Nino 3 & Nino 3.4 Region  F4

NCEP Markov Model
Eq. Pac. SST & Anomalies  F5
Nino 3.4 Region  F6

LDEO Model
Eq. Pac. SST & Wind Stress Anoms  F7
Nino 3 Region  F8

ENSO-CLIPER Model
All Nino Regions & SOI  F9

IRI Compilation of Forecasts
Nino3.4 Region  F10


NCEP Coupled Model Forecasts for Nino 3 & Nino 3.4 Regions

DECEMBER 2021
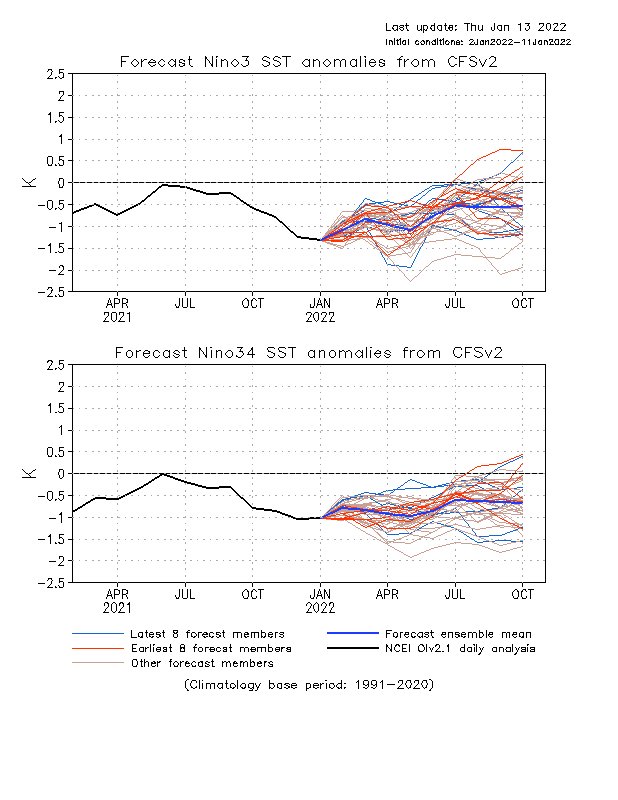
FIGURE F4.  Predicted and observed sea surface temperature (SST) anomalies for the Nino 3 (top) and Nino 3.4 (bottom) regions from the NCEP Coupled Forecast System Model (CFSv2). The forecasts consist of 40 forecast members. The ensemble mean of all 40 forecast members is shown by the blue line, individual members are shown by thin lines, and the observation is indicated by the black line. The Nino-3 region spans the eastern equatorial Pacific between 5N-5S, 150W-90W. The Nno 3.4 region spans the east-central equatorial Pacific between 5N-5S, 170W-120W.


NOAA/ National Weather Service
NOAA Center for Weather and Climate Prediction
Climate Prediction Center
5830 University Research Court
College Park, Maryland 20740
Page Author: Climate Prediction Center Internet Team
Page Last Modified: January 2022
Disclaimer
Information Quality
Credits
Glossary
Privacy Policy
Freedom of Information Act (FOIA)
About Us
Career Opportunities