Skip Navigation Links www.nws.noaa.gov 
NOAA logo - Click to go to the NOAA home page National Weather Service   NWS logo - Click to go to the NWS home page
Climate Prediction Center
 

Climate Diagnostics Bulletin
Climate Diagnostics Bulletin - Home Climate Diagnostics Bulletin - Tropics Climate Diagnostics Bulletin - Extratropics


About the Forecast Forum

ENSO Forecast Discussion

ENSO and SST Model Forecasts

Canonical Correlation Model
Nino 3.4 Region: Historical  F1
Nino 3.4 Region: 0-4 Season  F2

NCEP Coupled Model
Eq. Pac. SST & Anomalies  F3
Nino 3 & Nino 3.4 Region  F4

NCEP Markov Model
Eq. Pac. SST & Anomalies  F5
Nino 3.4 Region  F6

LDEO Model
Eq. Pac. SST & Wind Stress Anoms  F7
Nino 3 Region  F8

Linear Inverse Modeling
Global Tropical SST Anomalies  F9
Nino 3.4 Region: Historical  F10

ENSO-CLIPER Model
All Nino Regions & SOI  F11

IRI Compilation of Forecasts
Nino3.4 Region  F12


NCEP Markov Model Forecasts of Eq. Pac. SST Anomalies

NOVEMBER 2017
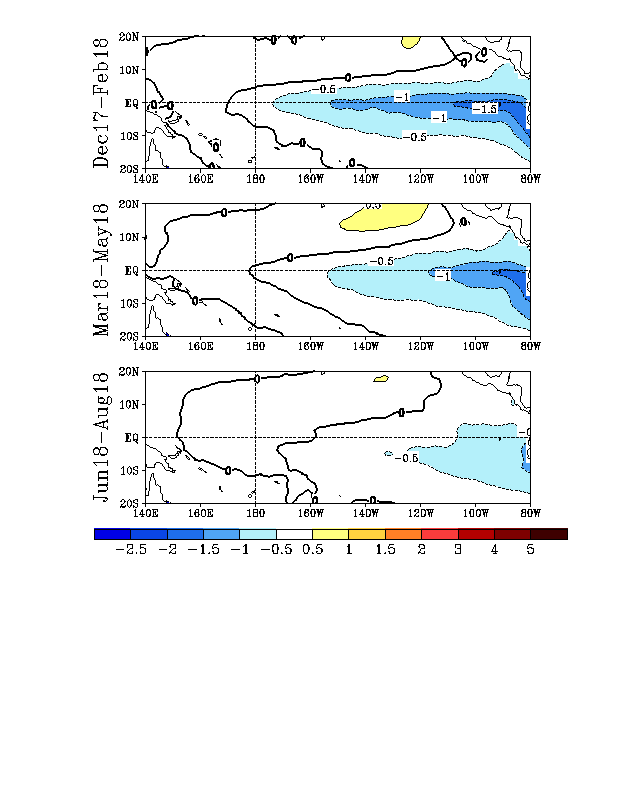
FIGURE F5.  Predicted 3-month average sea surface temperature anomalies from the NCEP/CPC Markov model (Xue et al. 2000, J. Climate, 13, 849-871). The forecast is initiated in NOVEMBER 2017 . Contour interval is 0.3C and negative anomalies are indicated by dashed contours. Anomalies are calculated relative to the 1971-2000 climatology.


NOAA/ National Weather Service
NOAA Center for Weather and Climate Prediction
Climate Prediction Center
5830 University Research Court
College Park, Maryland 20740
Page Author: Climate Prediction Center Internet Team
Page Last Modified: December 2017
Disclaimer
Information Quality
Credits
Glossary
Privacy Policy
Freedom of Information Act (FOIA)
About Us
Career Opportunities