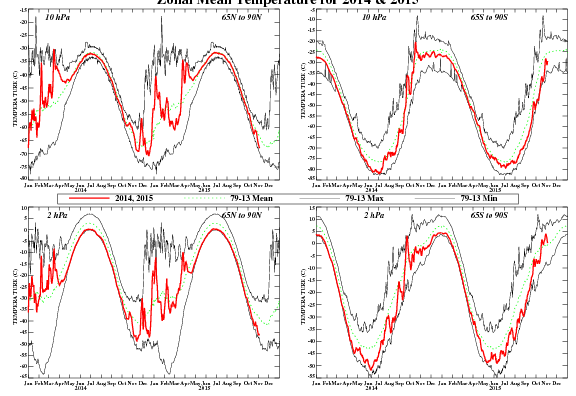
Skip Navigation Links www.nws.noaa.gov 
NOAA logo - Click to go to the NOAA home page National Weather Service   NWS logo - Click to go to the NWS home page
Climate Prediction Center
 

Climate Diagnostics Bulletin
Climate Diagnostics Bulletin - Home Climate Diagnostics Bulletin - Tropics Climate Diagnostics Bulletin - Forecast


  Extratropical Highlights

  Table of Indices  (Table 3)

  Global Surface Temperature  E1

  Temperature Anomalies (Land Only)  E2

  Global Precipitation  E3

  Regional Precip Estimates (a)  E4

  Regional Precip Estimates (b)  E5

  U.S. Precipitation  E6

  Northern Hemisphere

  Southern Hemisphere

  Stratosphere

  Appendix 2: Additional Figures


OCTOBER 2015

FIGURE S4.  Daily mean temperatures at 10-hPa and 2-hPa (red line) in the region 65N-90N and 65S-90S for the past two years. Dashed green line depicts the 1981-2010 base period daily mean. Thin solid black lines depict the daily extreme maximum and minimum temperatures.


NOAA/ National Weather Service
NOAA Center for Weather and Climate Prediction
Climate Prediction Center
5830 University Research Court
College Park, Maryland 20740
Page Author: Climate Prediction Center Internet Team
Page Last Modified: April 2024
Disclaimer
Information Quality
Credits
Glossary
Privacy Policy
Freedom of Information Act (FOIA)
About Us
Career Opportunities