 |
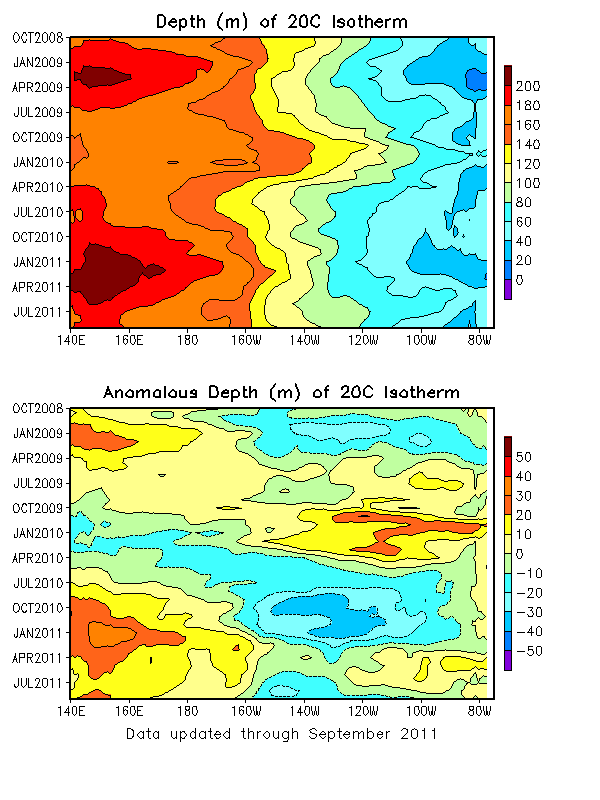
Mean and Anomalous Depth of the 20C Isotherm
SEPTEMBER 2011

FIGURE T15.
Mean (top) and anomalous (bottom) depth of the 20C isotherm
averaged between 5N-5S in the Pacific Ocean.
Data are derived from the NCEP's global ocean data assimilation
system which assimilates oceanic observations into an oceanic GCM
(Behringer, D. W., and Y. Xue, 2004: Evaluation of the global ocean data assimilation system at NCEP:
The Pacific Ocean. AMS 84th Annual Meeting, Seattle, Washington, 11-15).
The contour interval is 10 m.
Dashed contours in bottom panel indicate negative anomalies. Anomalies
are departures from the 1981-2010 base period means.
|
 |


