 |
NCEP Coupled Model Forecasts for Nino 3 & Nino 3.4 Regions
AUGUST 2017
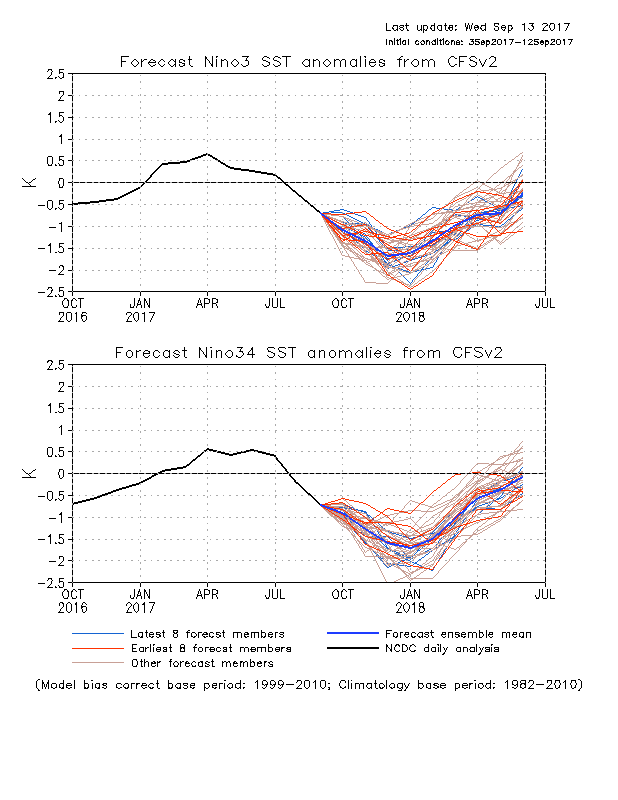
FIGURE F4.
Predicted and observed sea surface temperature (SST) anomalies for the Nino 3 (top) and Nino 3.4 (bottom) regions from the NCEP Coupled Forecast System Model (CFSv2). The forecasts consist of 40 forecast members. The ensemble mean of all 40 forecast members is shown by the blue line, individual members are shown by thin lines, and the observation is indicated by the black line. The Nino-3 region spans the eastern equatorial Pacific between 5N-5S, 150W-90W. The Nno 3.4 region spans the east-central equatorial Pacific between 5N-5S, 170W-120W.
|
 |


