Skip Navigation Links www.nws.noaa.gov 
NOAA logo - Click to go to the NOAA home page National Weather Service   NWS logo - Click to go to the NWS home page
Climate Prediction Center
 

Climate Diagnostics Bulletin
Climate Diagnostics Bulletin - Home Climate Diagnostics Bulletin - Forecast Climate Diagnostics Bulletin - Extratropics


  Tropical Highlights

  Table of Atmospheric Indices  (Table 1)

  Table of Oceanic Indices  (Table 2)

  Time Series

  Time-Longitude Sections

  Mean & Anomaly Fields

  Appendix 1: Outside Contributions

Tropical Pacific Drifting Buoys

Rick Lumpkin / Mayra Pazos, AOML, Miami

APRIL 2016

During April 2016, 358 satellite-tracked surface drifting buoys, 54% with subsurface drogues attached for measuring mixed layer currents, were reporting from the tropical Pacific. Across much of the basin, a number of drifters indicated westward anomalies of 30-50 cm/s on and near the equator.
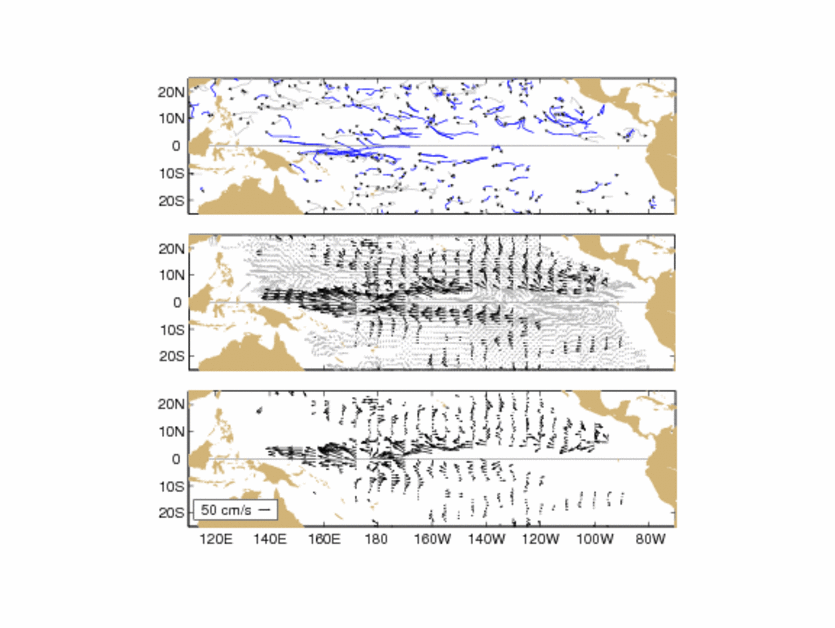
FIGURE A1.1 a) Top: Movements of drifting buoys in the tropical Pacific Ocean. The linear segments of each trajectory represent a one week displacement. Trajectories of buoys which have lost their subsurface drogues are gray; those with drogues are blue. b) Middle: Monthly mean currents calculated from all buoys 1993-2010 (gray), and currents measured by the drogued buoys this month (black) smoothed by an optimal filter. c) Bottom: Anomalies from the climatological monthly mean currents for this month.


NOAA/ National Weather Service
NOAA Center for Weather and Climate Prediction
Climate Prediction Center
5830 University Research Court
College Park, Maryland 20740
Page Author: Climate Prediction Center Internet Team
Page Last Modified: May 2016
Disclaimer
Information Quality
Credits
Glossary
Privacy Policy
Freedom of Information Act (FOIA)
About Us
Career Opportunities