|
NCEP Markov Model Forecasts of Eq. Pac. SST Anomalies
APRIL 2012
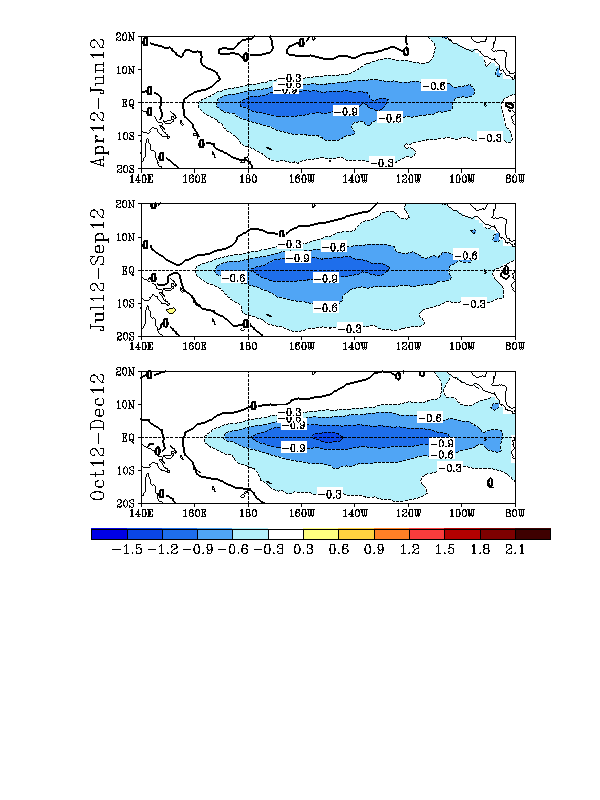
FIGURE F5.
Predicted 3-month average sea surface temperature anomalies from the NCEP/CPC Markov model (Xue et al. 2000, J. Climate, 13, 849-871). The forecast is initiated in APRIL 2012
. Contour interval is 0.3C and negative anomalies are indicated by dashed contours. Anomalies are calculated relative to the 1971-2000 climatology.
|