 |
Sea Surface Temperature and Sea Level From Eastern Pacific
GOES Stations
David B. EnField, NOAA/AOML
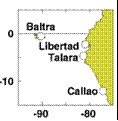
Instituto Oceanografico de la Armada Guayaquil, Ecuador
Direccion de Hodrografia y Navigacion de la Marina, Callao, PERU
FEBRUARY 2010
|
Through
cooperative arrangements with South American institutions, the TOGA
program has maintained a network of nine tide stations and four
meteorological stations in Ecuador, Peru and Chile since the mid
1980's. The stations are maintained by NOAA/AOML and the University of
Hawaii. The hourly data are transmitted to down-link stations via the
GOES satellite in real time and processed. The five-day averages
(pentads) at critical stations give us an effective means of monitoring
coastal conditions with good time resolution and compact data volume.
|
|
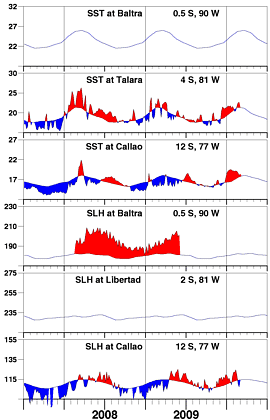
At the end of February SSTs and sea levels plunged suddenly
to normal or below normal values. This could signal the end
of the El Niño event in the NINO 1+2 region. SST anomaly maps
of the Pacific are showing that the warm anomalies are mainly
concentrated near the dateline.
|
| |
|
Day of   Sea Sfc Temperature    Sea Level Height (cm)
 Feb     Baltra Talara Callao   Baltra Libertad Callao
------   ------ ------ ------   ------  ------  ------
   2       **    20.3   19.0       **      **    124.5
   7       **    20.6   19.2       **      **    118.6
  12       **    21.7   19.0       **      **    111.0
  17       **    22.5   18.7       **      **    107.1
  22       **    22.6   18.0       **      **      **
  27       **     **    18.3       **      **      **

                       Anomalies
   2       **    -0.5    2.0       **      **     11.0
   7       **    -0.5    2.1       **      **      4.7
  12       **     0.4    1.7       **      **     -3.1
  17       **     1.1    1.2       **      **     -7.1
  22       **     1.3    0.4       **      **      **
  27       **     **     0.6       **      **      **

For further information contact David.Enfield@noaa.gov
 or go to http://www.aoml.noaa.gov/phod/epac/
 ** - Data missing due to hardware failure
|
FIGURE A1.5
Five-day averages of Sea Surface
Temperature (SST, C) and Sea Level Height (SLH, cm) from GOES receiving
stations in Ecuador and Peru. Dashed line and shading show climatology
departures.
|
 |


