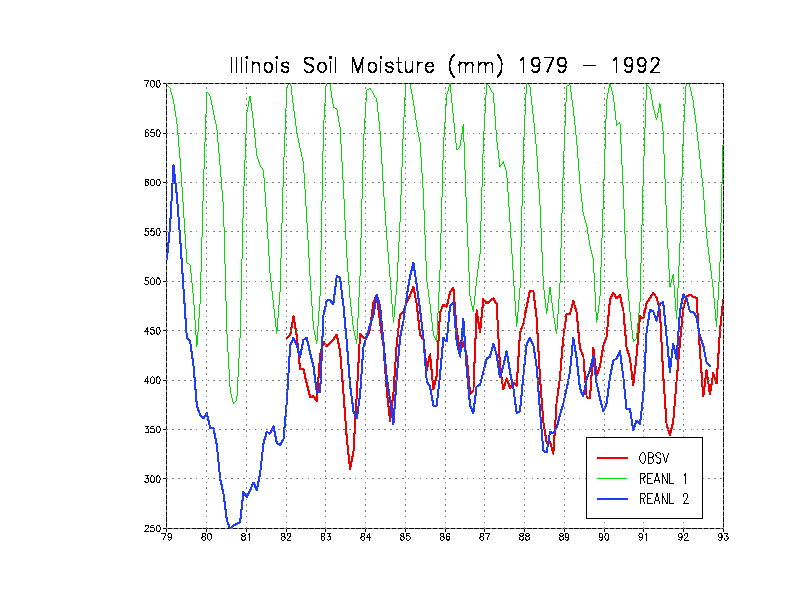
Figure 2: Comparison of analyzed soil moisture with observation. The curve with large regular variation is from N/N, the curve starting from '82 is observation and the remaining curve is from R-2.
Masao Kanamitsu(1), Wesley Ebisuzaki(1),
Jack Woolen(2)
Jerry Potter(3), Michael Fiorino(4)
(1) CPC/NCEP, Washington, DC20233, USA
(2) EMC/NCEP, Washington, DC20233, USA
(3) PCMDI/LLNL, Livermore, CA94550, USA
(4) ECMWF, Shinfield Park, Reading, Berkshire, RG2 9AX,
U.K.
NCEP/DOE AMIP-II Reanalysis (Reanalysis-2) is a follow-on project to the NCEP/NCAR Reanalysis Project (N/N Reanalysis). In Reanalysis-2, global analyses are made using an updated forecast model, updated data assimilation system, improved diagnostic outputs and fixes for the known processing problems of N/N Reanalysis.
The analyses are available to the public from web site described at the end of this abstract. The analyses will also be available from NCAR in future. Major application of the product is to use it as a reference analysis for AMIP-2 project, which is sponsored by PCMDI. Several AMIP-2 experiments with the reanalysis-2 model are in progress at NCEP and at the Scripps Institute of Oceanography to supplement the analysis. The AIMS phase of the WOCE program will be using the surface fluxes. Production run has been going smoothly. The analyses have been produced with a rate of one year of analyses per 3-4 weeks. The first analysis (January 1979) was started in early 1998 and analyses of 1993 is nearly complete at the time of writing.
Reanalysis-2 should be considered as an updated N/N Reanalysis and not a next-generation reanalysis. Although Reanalysis-2 has some significant improvements, a next-generation reanalysis would have much higher resolution, assimilation of rainfall and radiances, a much improved forecast model, (better) use of SSM/I data and be based on better theoretical techniques such as 4D-variational assimilation.
Preliminary results from Reanalysis-2 have been encouraging. The fixes to the human processing errors have made major changes to some of the fields and changes to the system itself have lead to other significant improvements.
2. SYSTEM DESCRIPTION
Similarities:

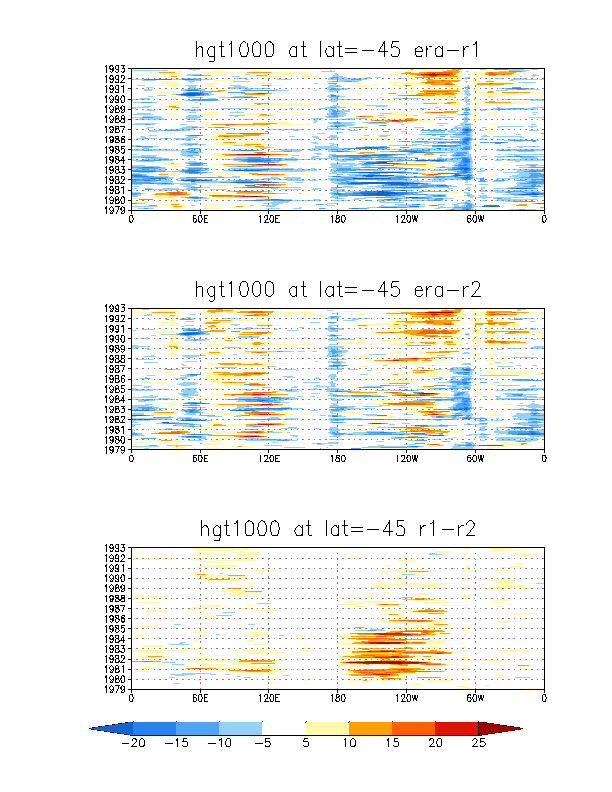
As an example of the impact of error correction, the differences
of x-t diagrams of monthly average 1000 hPa height at 45 South between
the ERA and N/N reanalysis, ERA and R-2, and N/N and R-1 are shown in Figure
1. We see that there are less differences between ERA and R-2 than ERA
and N/N before 1985 showing that the correction of PAOBS made impact on
monthly average particularly over the longitude 180W-60W.
One unique feature of Reanalysis-2 is the treatment of soil moisture. N/N Reanalysis forced the soil moisture by using the model precipitation and a 60-day nudging term to climatology. Compared to Illinois observations, the annual cycle in N/N Reanalysis was too strong, partially due to nudging term. Perhaps the soil model in Reanalysis was incompatible with the model used to compute the soil-moisture climatology.
In experiments the nudging term was removed which resulted in unrealistically dry regions in South America. This is suggestive of a positive feedback between the model precipitation and the soil moisture. In order to avoid the positive feedback amplifying the precipitation bias, Reanalysis-2 uses observed precipitation to correct the errors in the model precipitation. The observed precipitation (pentad means based on gauge and satellite estimates from Xie-Arkin) was used to correct the errors in the model precipitation when the soil was not frozen. In cases of no model runoff, the error in the model precipitation during the previous pentad is added to the upper soil layer (10cm) uniformly in time. For example if the model precipitation was low by 1 mm/day then 1 mm/day was added top soil layer during the next pentad. The soil-moisture correction scheme is modified in cases of (model) runoff. Errors in the model precipitation are assumed to affect the runoff rather than the soil moisture. The only exception is when the observed precipitation is less than the water entering the top soil layer. In this case, soil moisture is removed by an amount of ((model precip. - runoff) - obs. precip.). The improvement made to the soil wetness analysis is found to be dramatic. The comparison of real observation available over Illinois shown in Figure 2 (make by Jin Huang) indicates that the soil wetness in R-2 agrees quite well. On the other hand, that of N/N reanalysis has too large annual variation with very little interannual variability.

3. EVALUATION
The evaluations of Reanalysis-2 are now in progress. Following
lists major findings.
Improvements:

Possible drawbacks:
4. SUMMARY
In summary, Reanalysis-2 is an updated global analysis which fixes the known processing errors in the N/N Reanalysis as well as uses an improved forecast model and data assimilation system. It provides a better reanalysis and recommended for the users who are affected by known errors. Examples of studies include a) analyses of transients in S.H., particularly case studies, b) use of near surface temperatures and snow cover over the N.H. continents in winter, especially in high latitudes and c) analysis of snow budget. The Reanalysis-2 will provide more accurate pictures of a) soil wetness and near surface temperature, b) hydrology budget, c) hydrology budget in polar regions and d) snow cover. It should also be noted that the Reanalysis-2 may not necessarily provide better analyses than N/N. The OLR over tropical warm pool and tropical upper level moisture are the known fields possibly worse than the N/N analyses. Reanalysis-2 can be used with N/N Reanalysis to understand the sensitivity of the analysis to changes in the model parameterizations. Such sensitivity is one factor affecting the accuracy of the various reanalysis efforts. More information and analyses can be obtained from: http://wesley.wwb.noaa.gov/reanalysis2.