|
ATTENTION:
The Climate Prediction Center is soliciting
comments from August 1, 2023 through December 31, 2024 on the implementation
of the Week 2
and experimental Week 3 Global Tropics Hazards Outlook.
Here is the Survey.
|
GTH Outlook Map and Data
|
Last Updated -
07/23/24
|
|
|
|
|
|
GTH Outlook Discussion
|
Last Updated -
07/23/24
|
Valid -
07/31/24 - 08/13/24
|
The Madden Julian Oscillation (MJO) has remained weak since June, staying within the RMM-based unit circle aside from occasional short bursts of activity. Destructive interference with enhanced equatorial Rossby Wave activity has resulted in reduced MJO amplification across the Eastern Hemisphere. Despite this, the global upper-level velocity potential pattern is more organized and resembles a wave-1 asymmetry. Anomalous upper-level divergence is noted across much of Asia and the Pacific, with anomalous convergence over the Americas and Atlantic. Dynamical models predict the MJO to remain weak, although some convective enhancement across the Western Hemisphere is depicted by week-2 in several GEFS and ECMWF ensemble members tied to a Convectively-Coupled Kelvin Wave (CCKW).
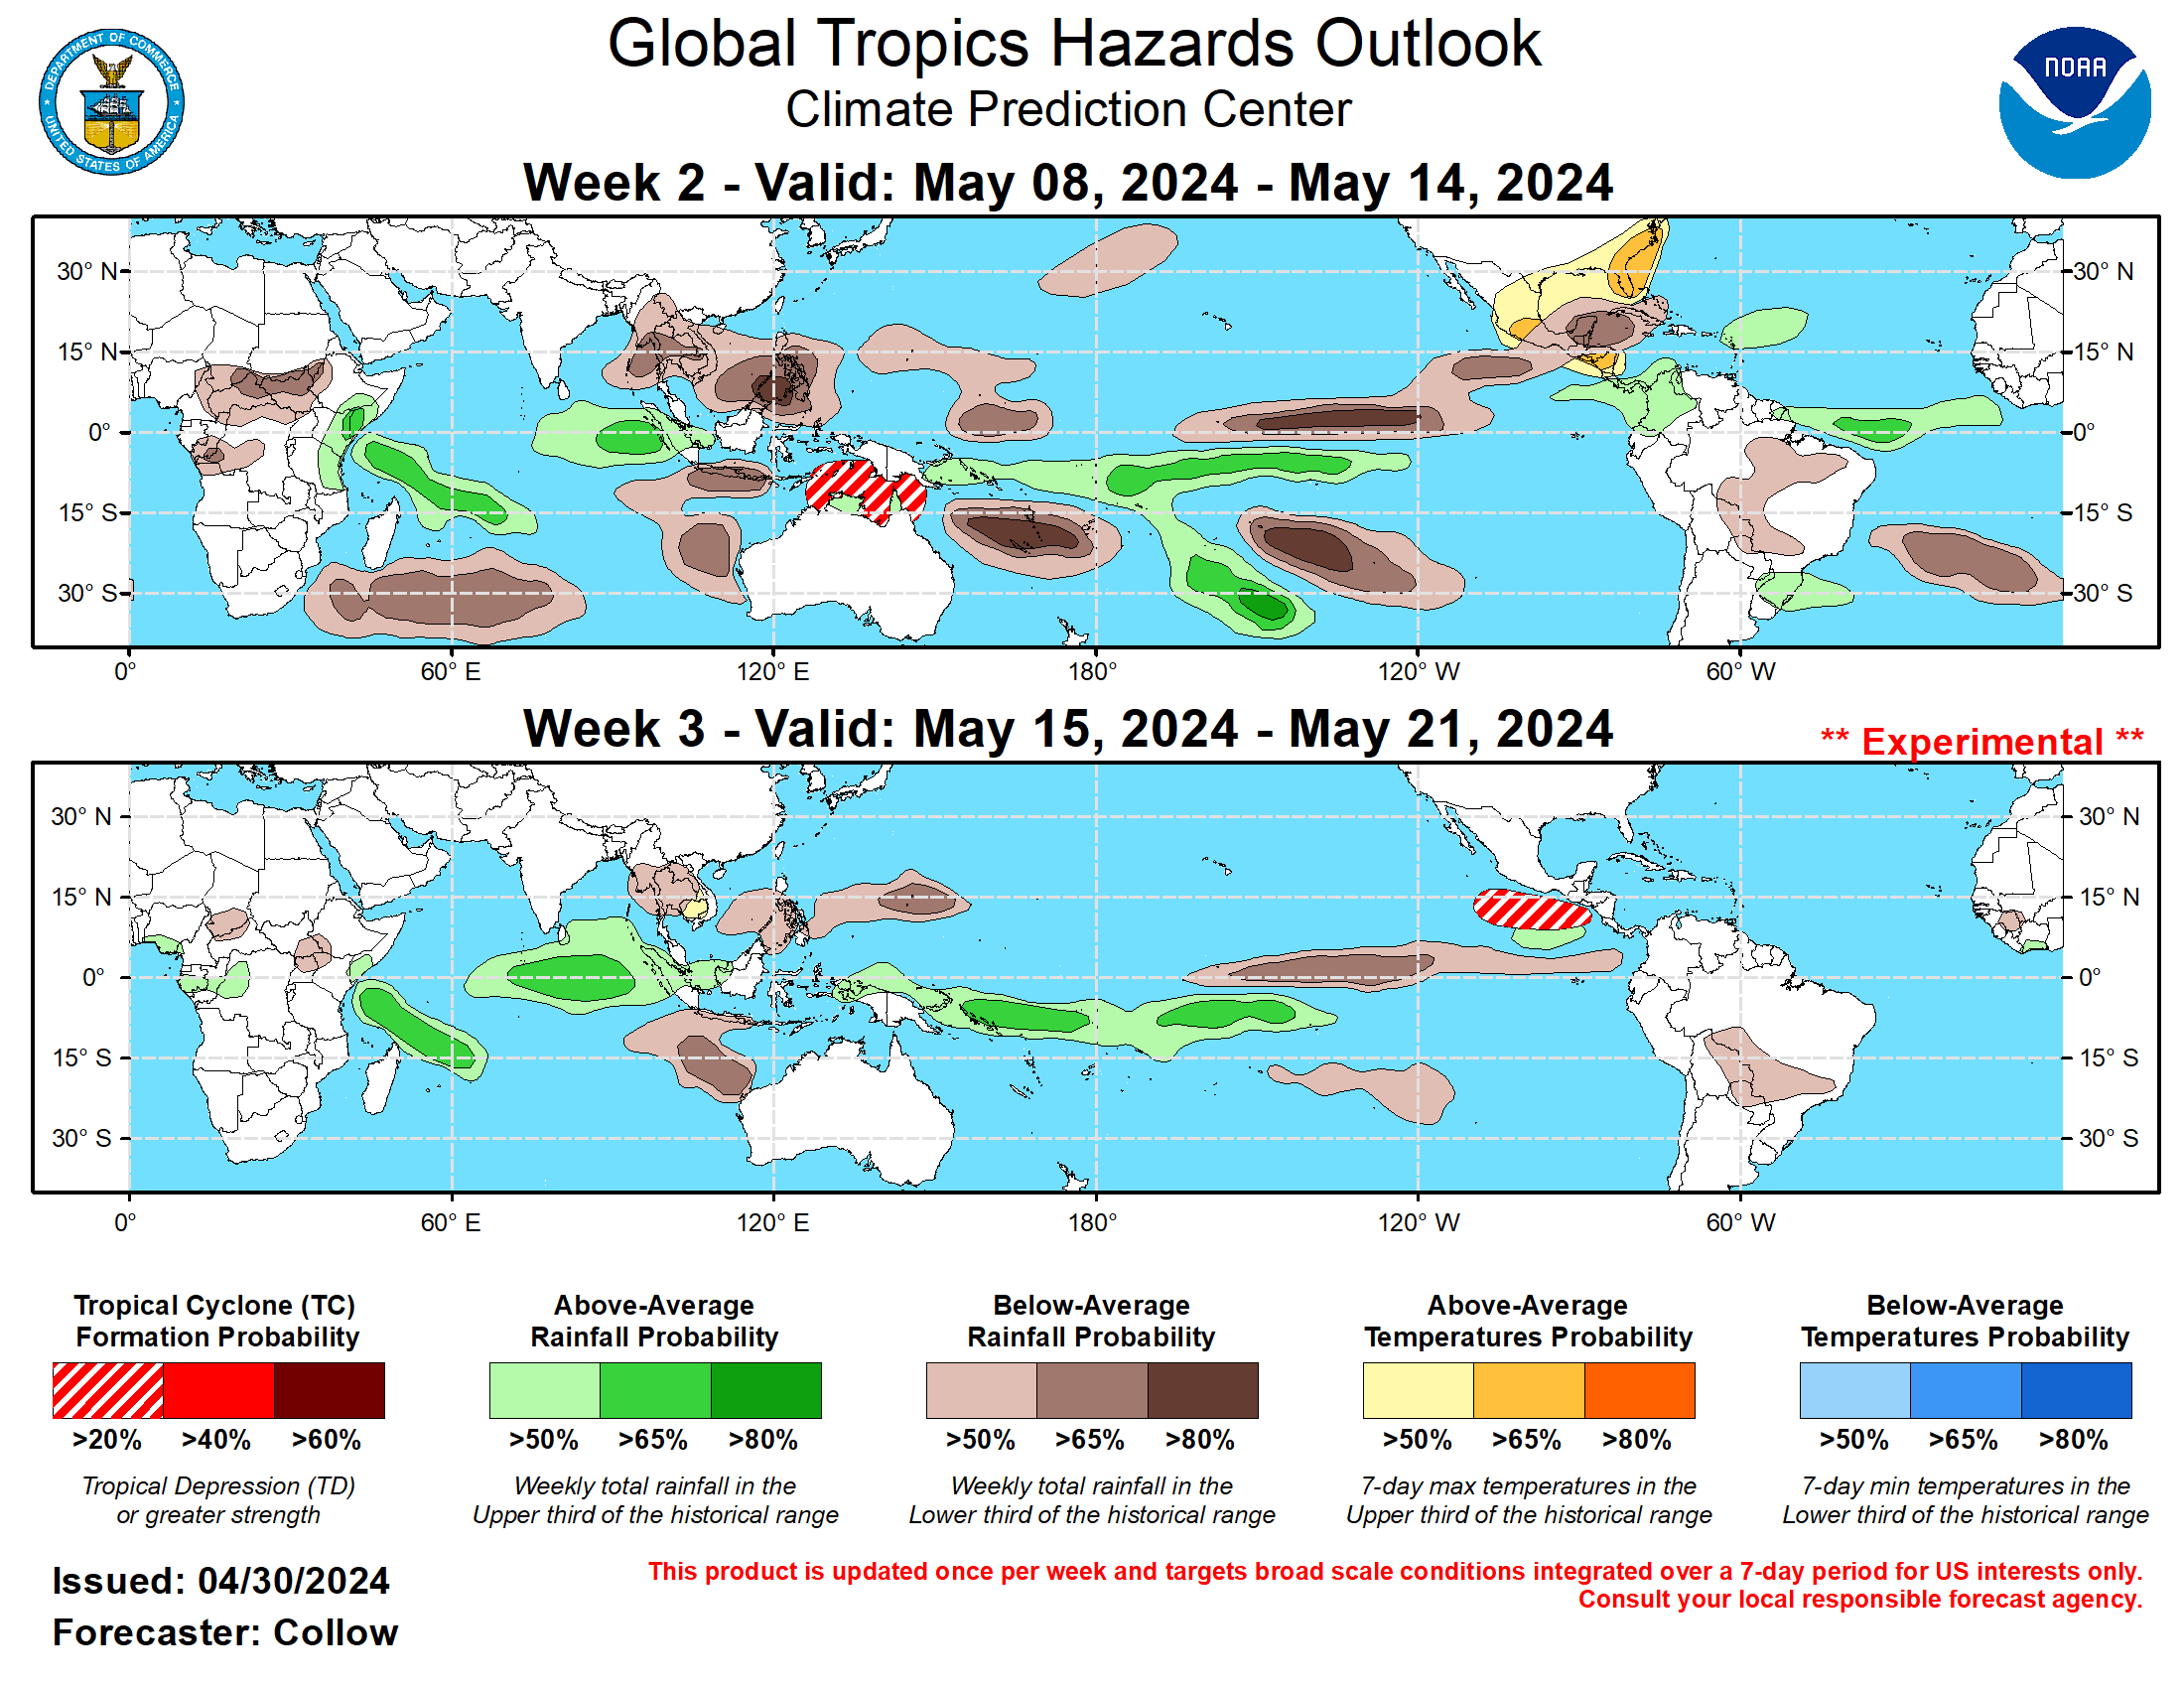
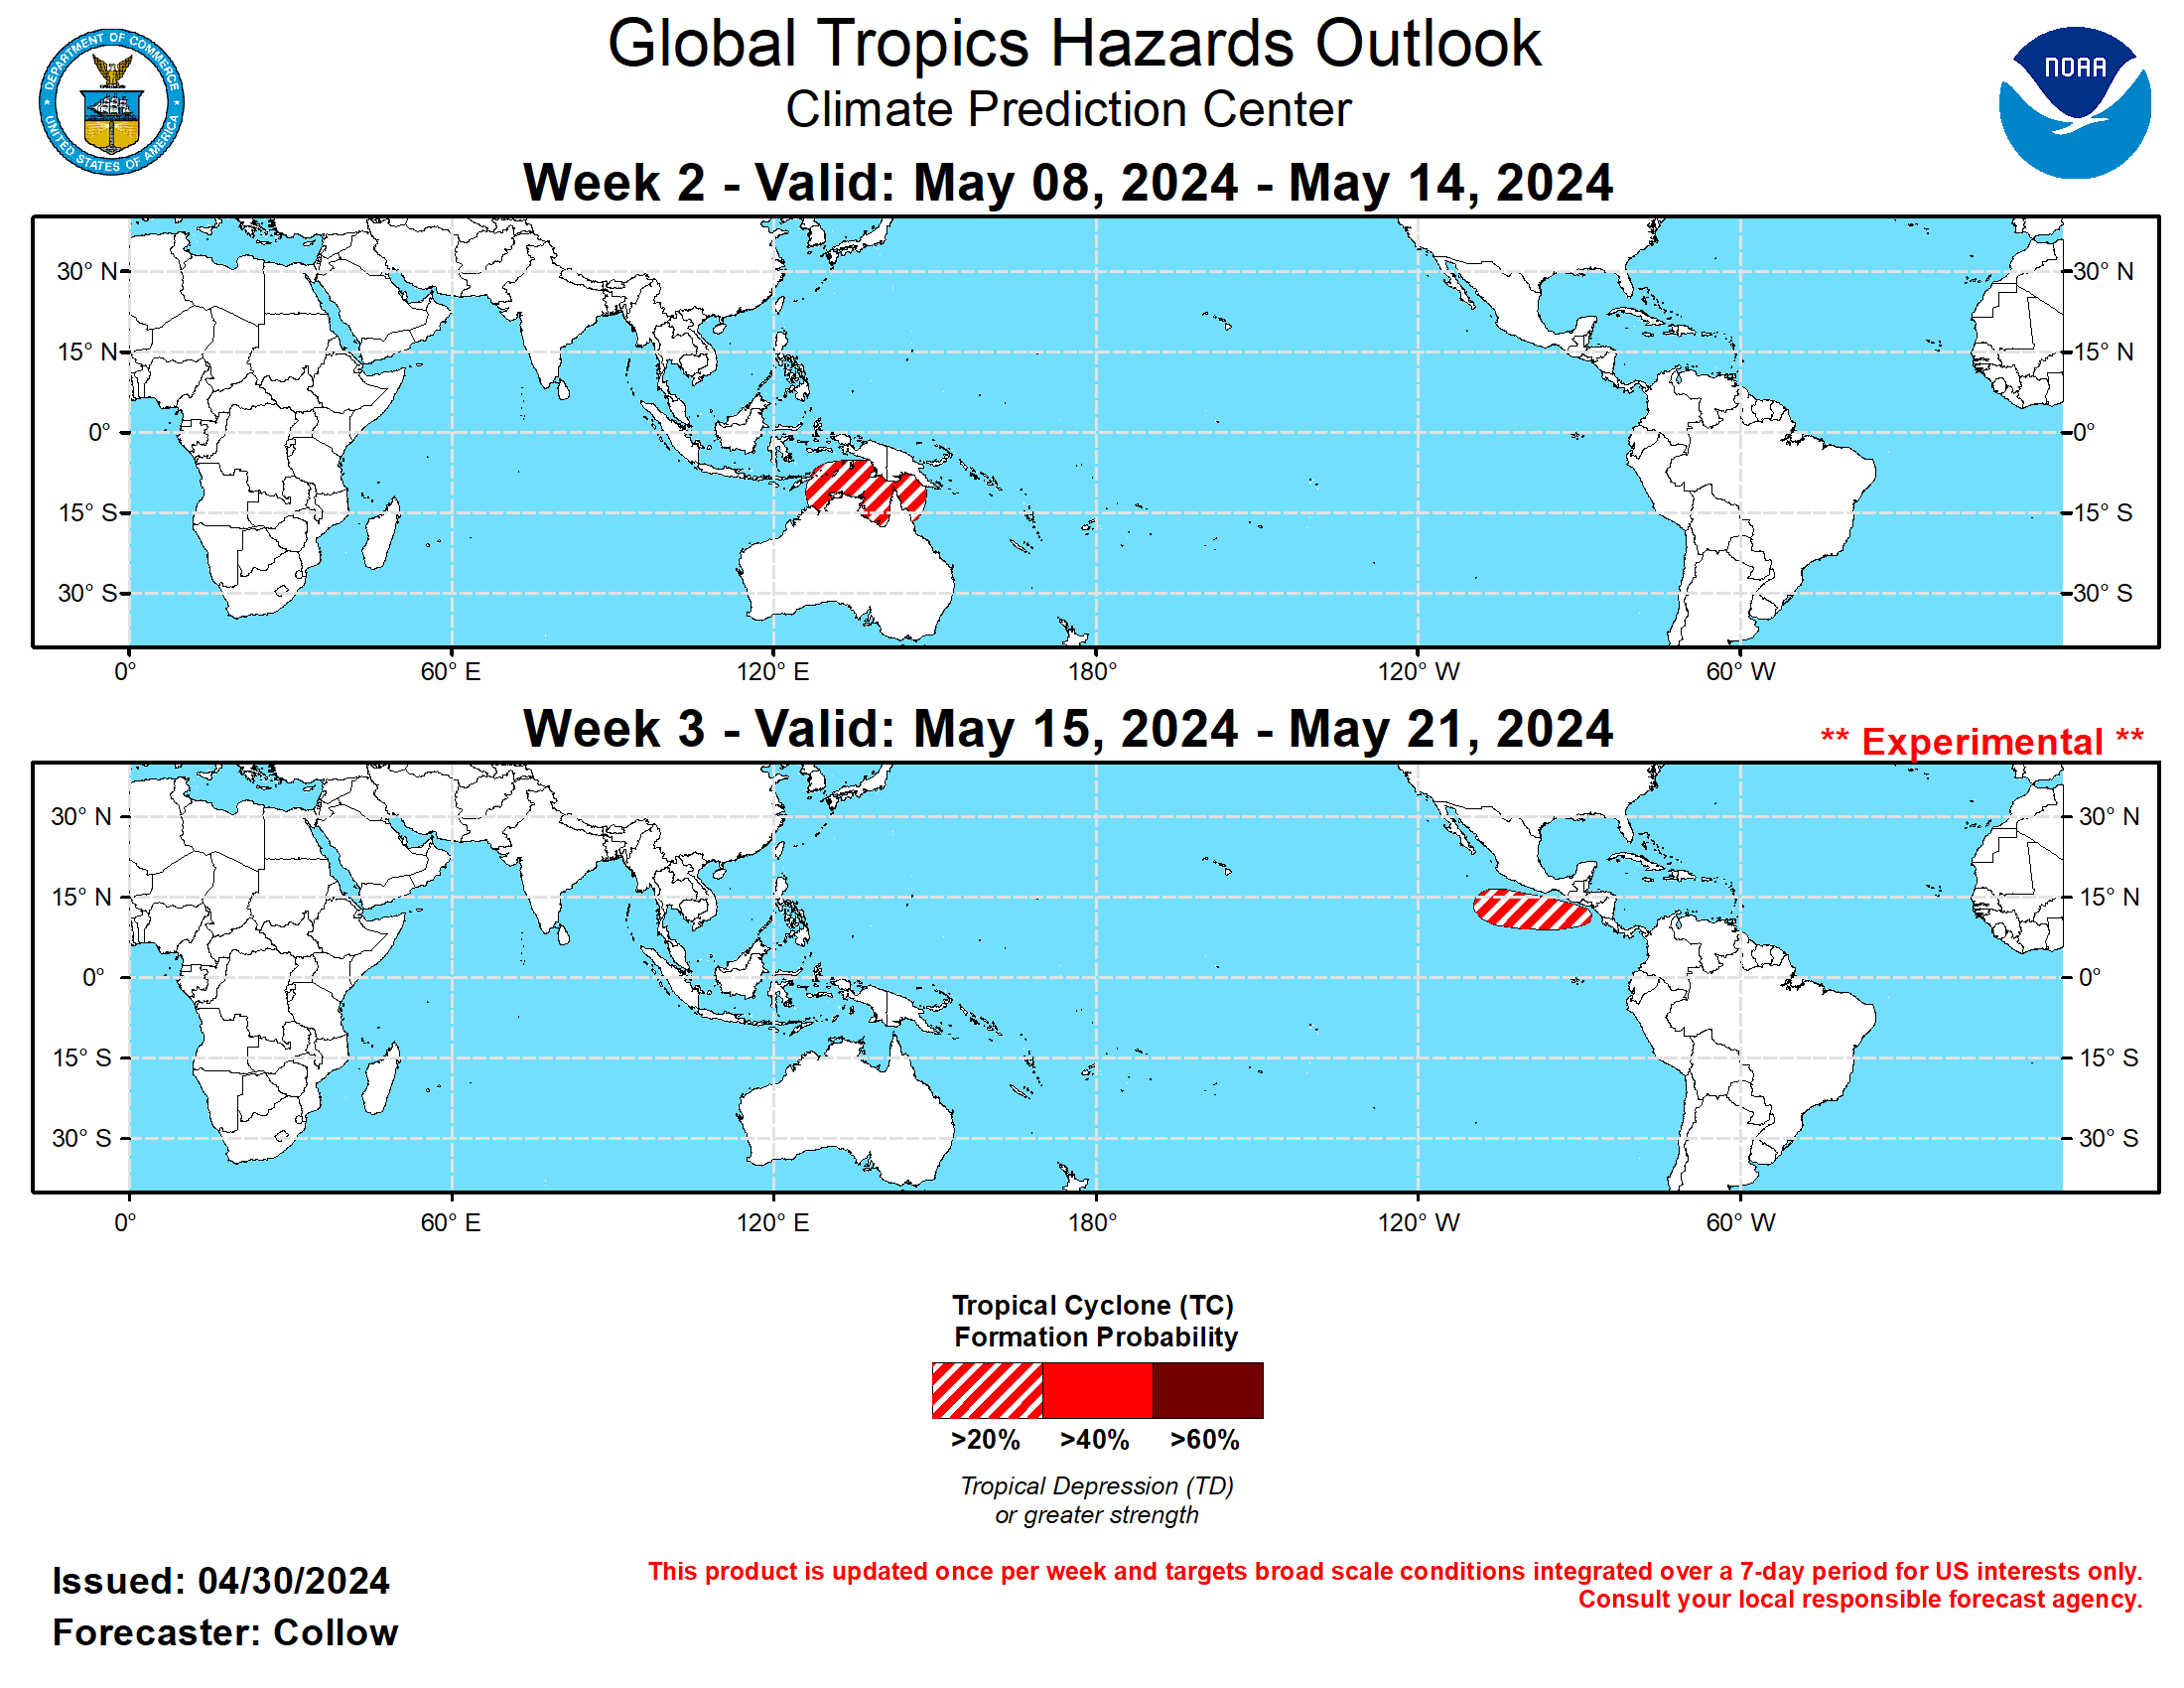
Tropical Cyclone (TC) activity has increased across the Western Pacific with 2 TCs developing on 7/20, Typhoon Gaemi to the east of the Philippines, and Tropical Storm Prapiroon over the South China Sea. The prevailing pattern favors increased tropical cyclone (TC) activity to continue over the Western Pacific, and expand into the Eastern Pacific. A 20-40 percent chance for TC development is posted across the Western Pacific for week-2, and is shifted northward and eastward compared to current activity. For the Eastern Pacific, the National Hurricane Center is highlighting 2 disturbances for potential TC development in week-1 (20 and 30 percent chances), and several 0z GEFS and ECMWF ensemble members depict continued TC activity in week-2 as the convective environment aloft becomes more favorable due to the aforementioned CCKW. Therefore, a 40-60 percent chance for TC formation is highlighted across the basin in week-2, decreasing to 20-40 percent in week-3.
The uptick in TC activity in the Eastern Pacific may spread into the Atlantic as well, although tools are not as robust. However, given the increasing climatology and anomalously warm sea surface temperatures (SSTs), it is plausible that TC development could occur following a quiet period for the better part of July. For week-2, some ECMWF ensemble members depict TC development across the western Atlantic or northern Caribbean, with the GEFS not showing any signal. However, an increasing wave train off of Africa and an increasingly favorable environment support having a 20-40 percent chance of TC formation across the western Atlantic for week-2, with the highlighted area more focused on the Main Development Region during week-3.
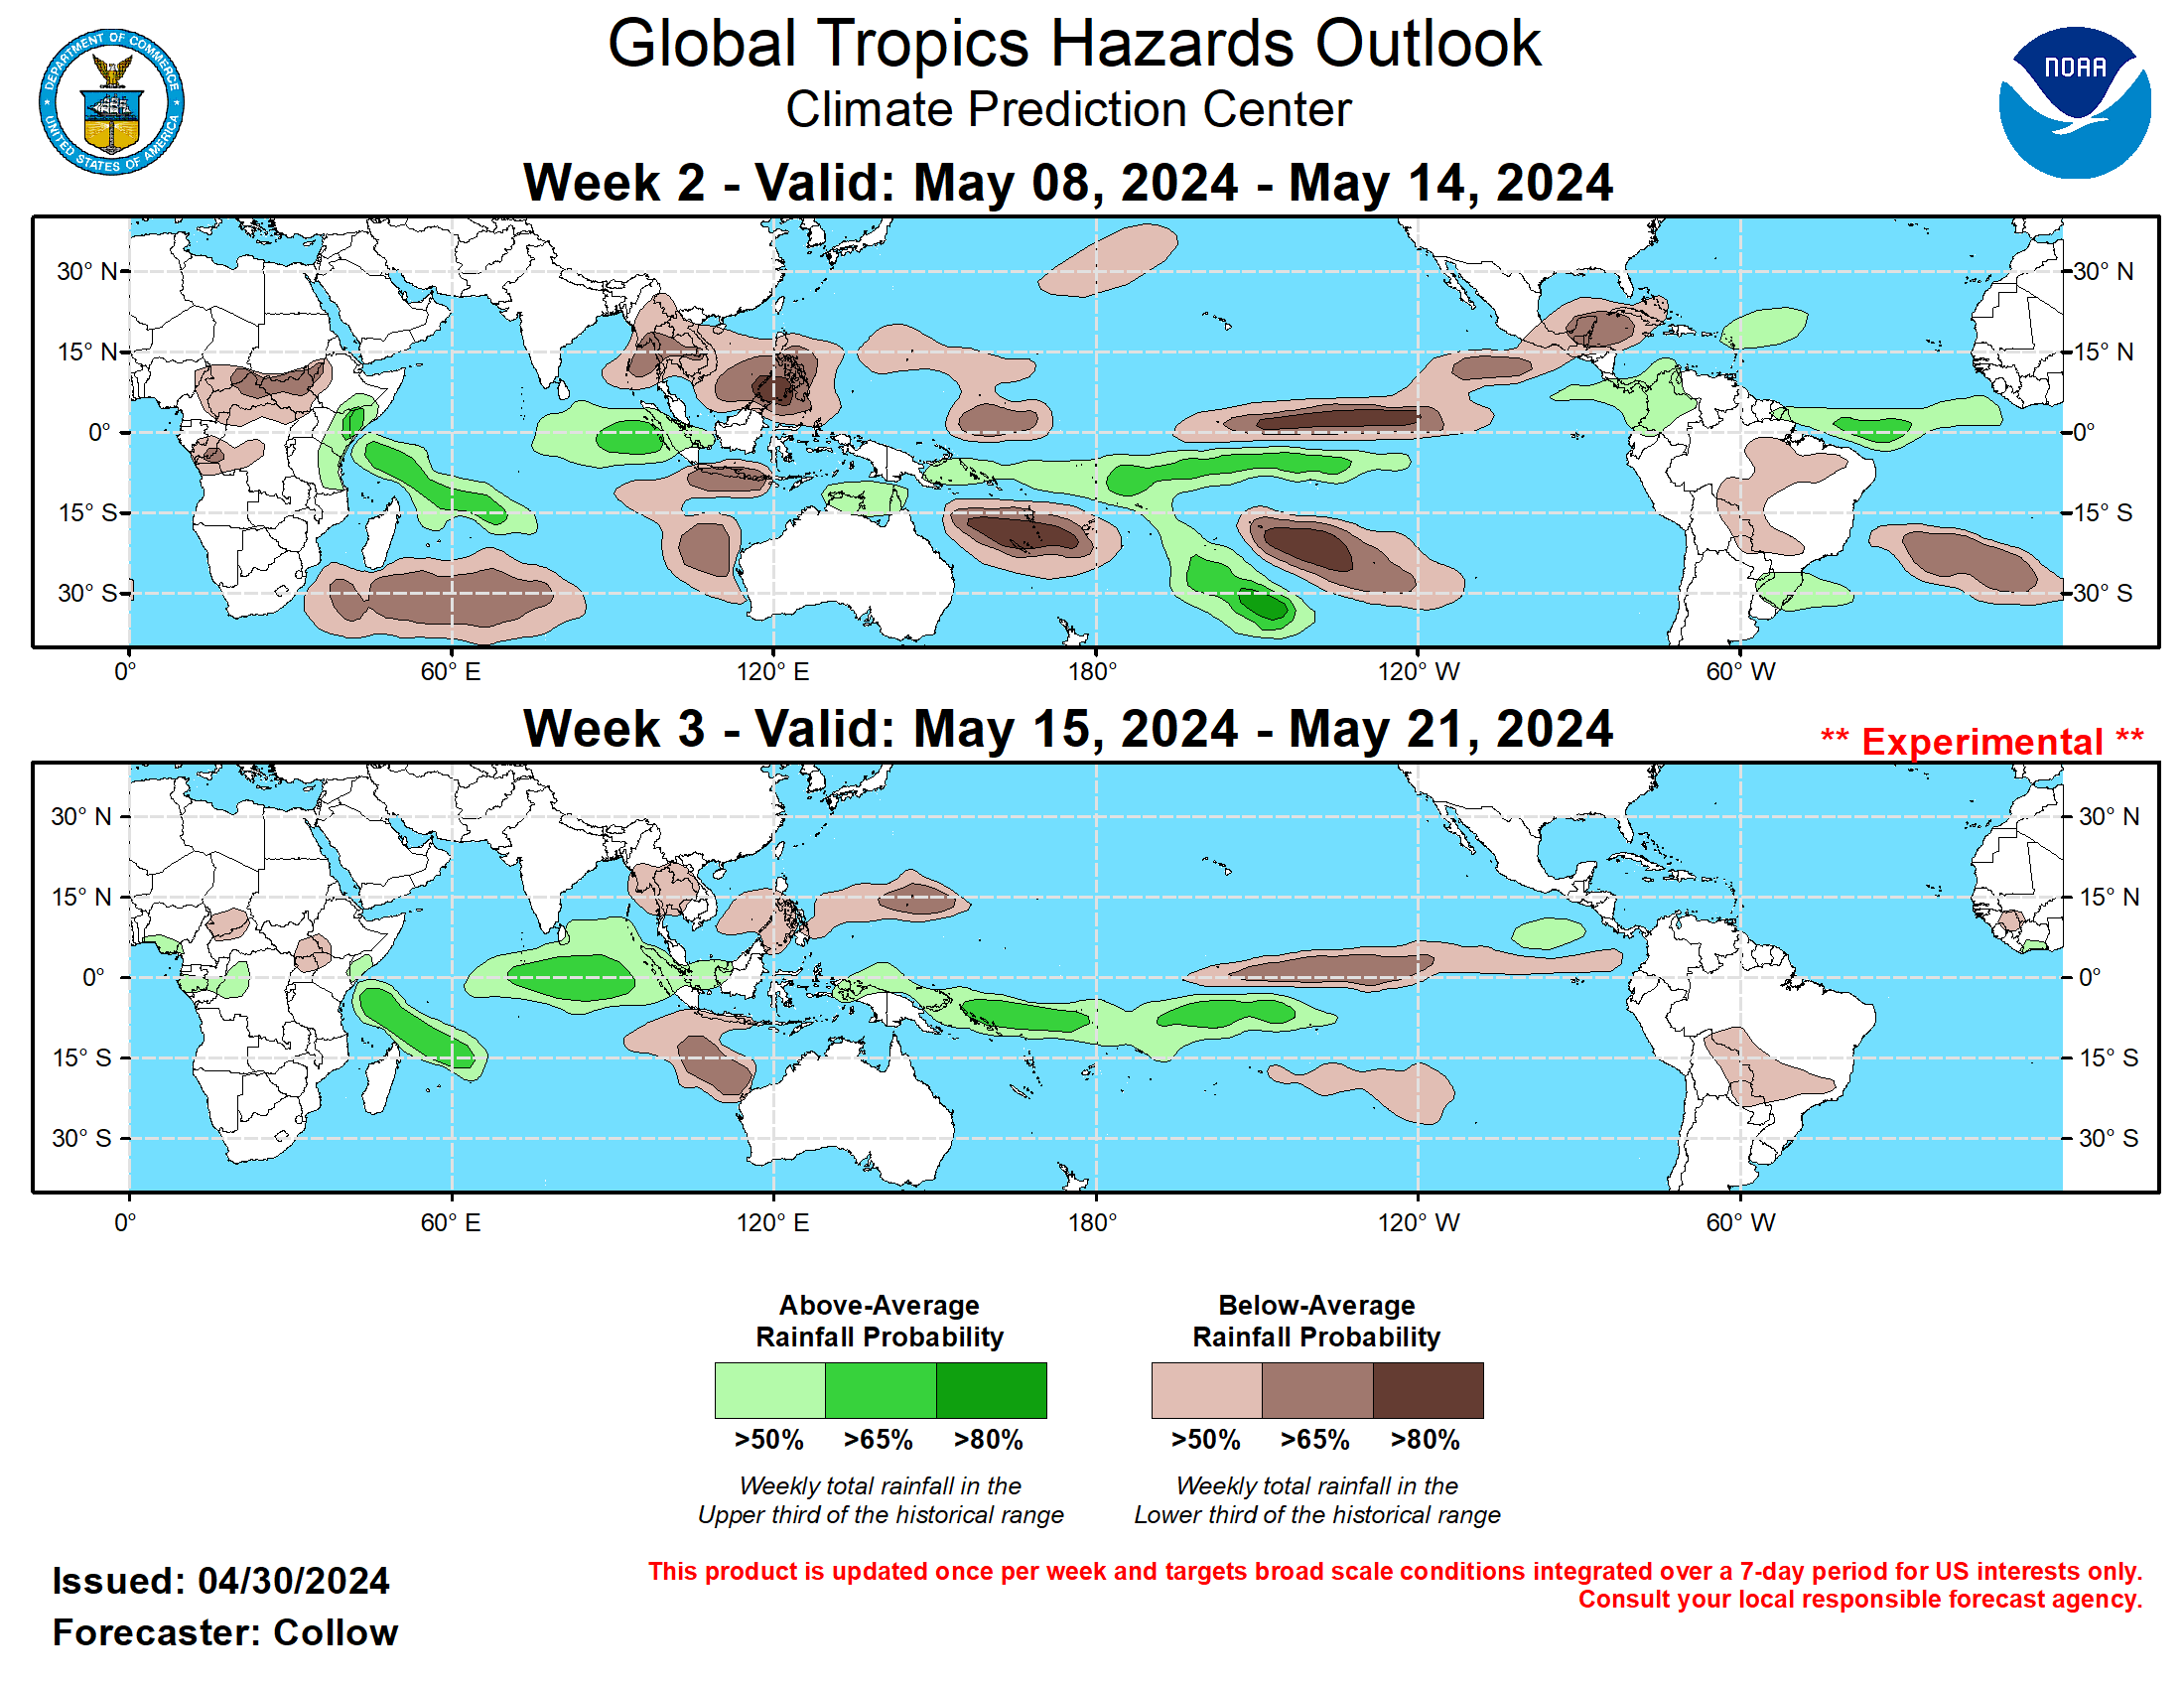
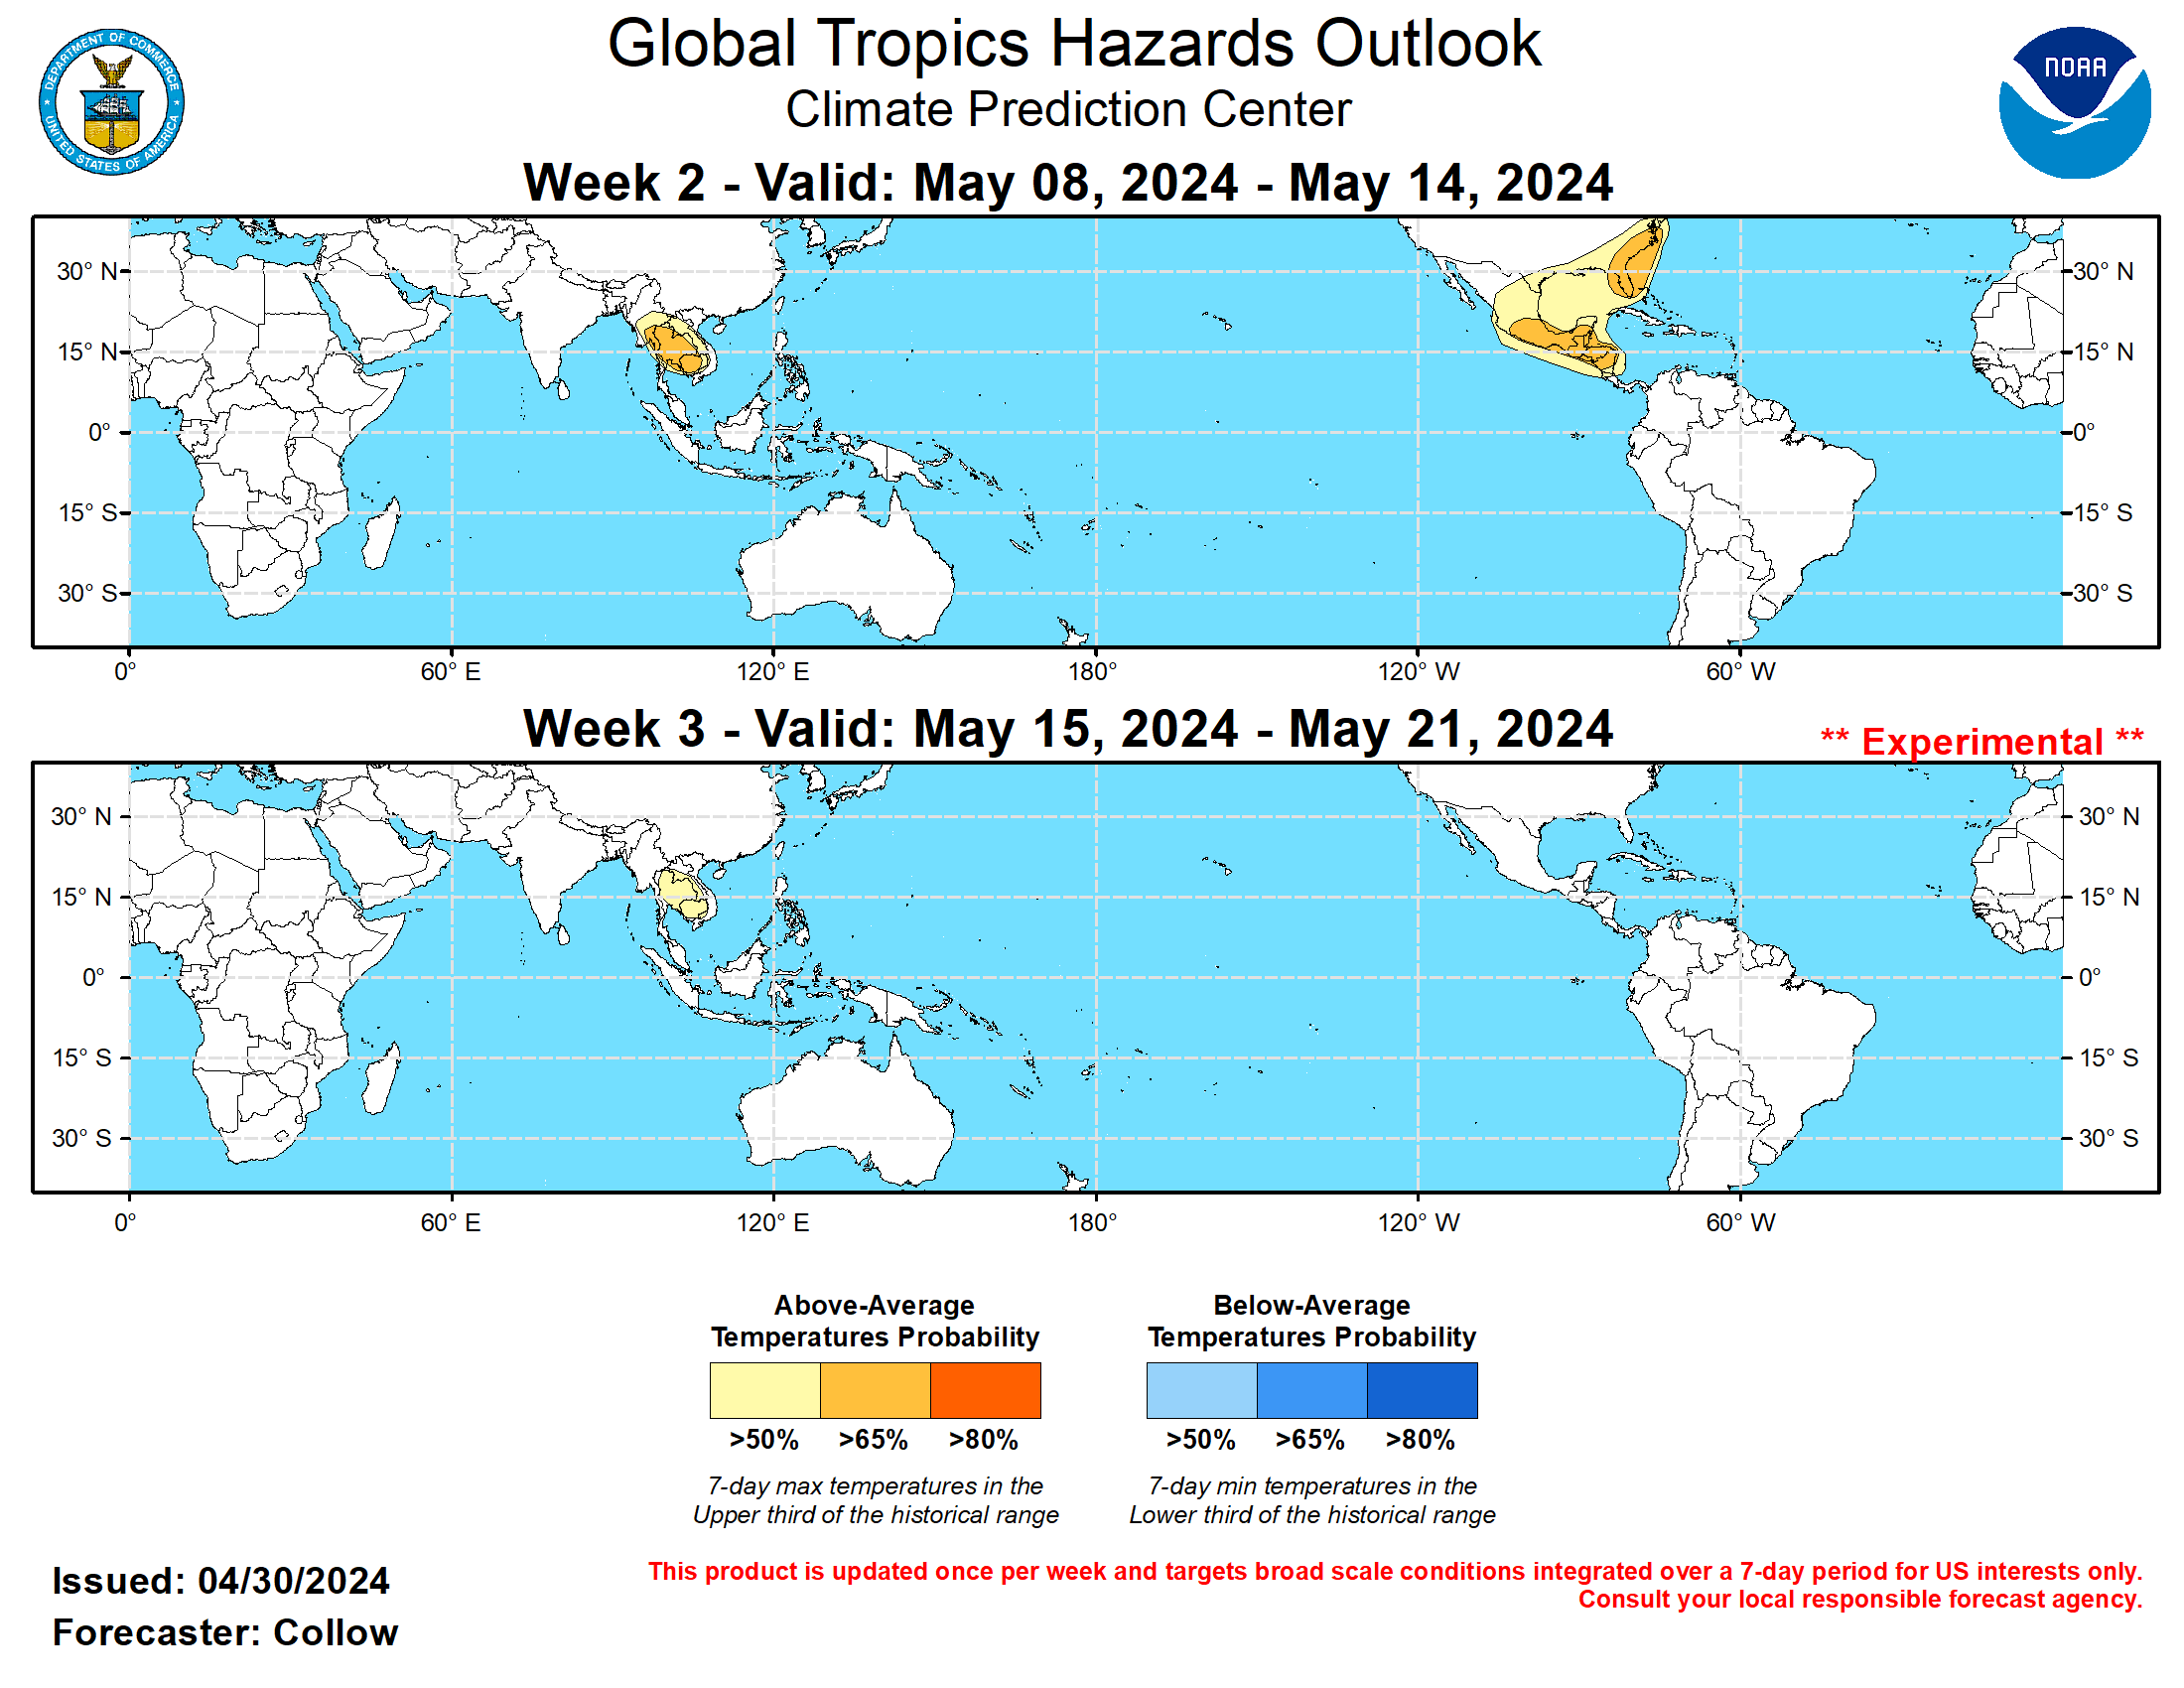
The precipitation outlook for weeks 2 and 3 is based on potential TC activity, the anticipated state of El Nino and the MJO, and informed by GEFS, CFSv2 and ECMWF ensemble mean solutions. Enhanced rainfall is forecast across parts of the Eastern Pacific and Central America during weeks 2 and 3, with increased chances for below-normal rainfall over northern South America and the equatorial Atlantic. Above-normal rainfall is favored over parts of southeastern Asia and the western Pacific during week-2, but a shifting convective pattern favors decreasing chances in week-3 with some areas becoming more favored to have below-normal rainfall. Above-normal temperatures along with excessive heat conditions are forecast over much of the continental U.S. during early August.
For hazardous weather conditions in your area during the coming two-week period, please refer to your local NWS office, the Medium Range Hazards Forecast produced by the Weather Prediction Center, and the CPC Week-2 Hazards Outlook. Forecasts made over Africa are made in coordination with the International Desk at CPC.
|
Product Release Information
The Global Tropics Hazards Outlook (GTH) is released once per week every Tuesday at 1730 UTC (1830 UTC when on standard time) including U.S. federal holidays.
At the time of product release, there is a live briefing (available via Google Meet) open to all stakeholders where the latest conditions and the newly
released outlook are shared with the opportunity to ask questions. Folks that are interested in learning more or attending these briefings should contact
Jon.Gottschalck@noaa.gov, Scott.Handel@noaa.gov, Adam.Allgood@noaa.gov and Nicholas.Novella@noaa.gov for the required information. Each weekly outlook and GTH release briefing is
Archived and available on the website.
|
Product Description
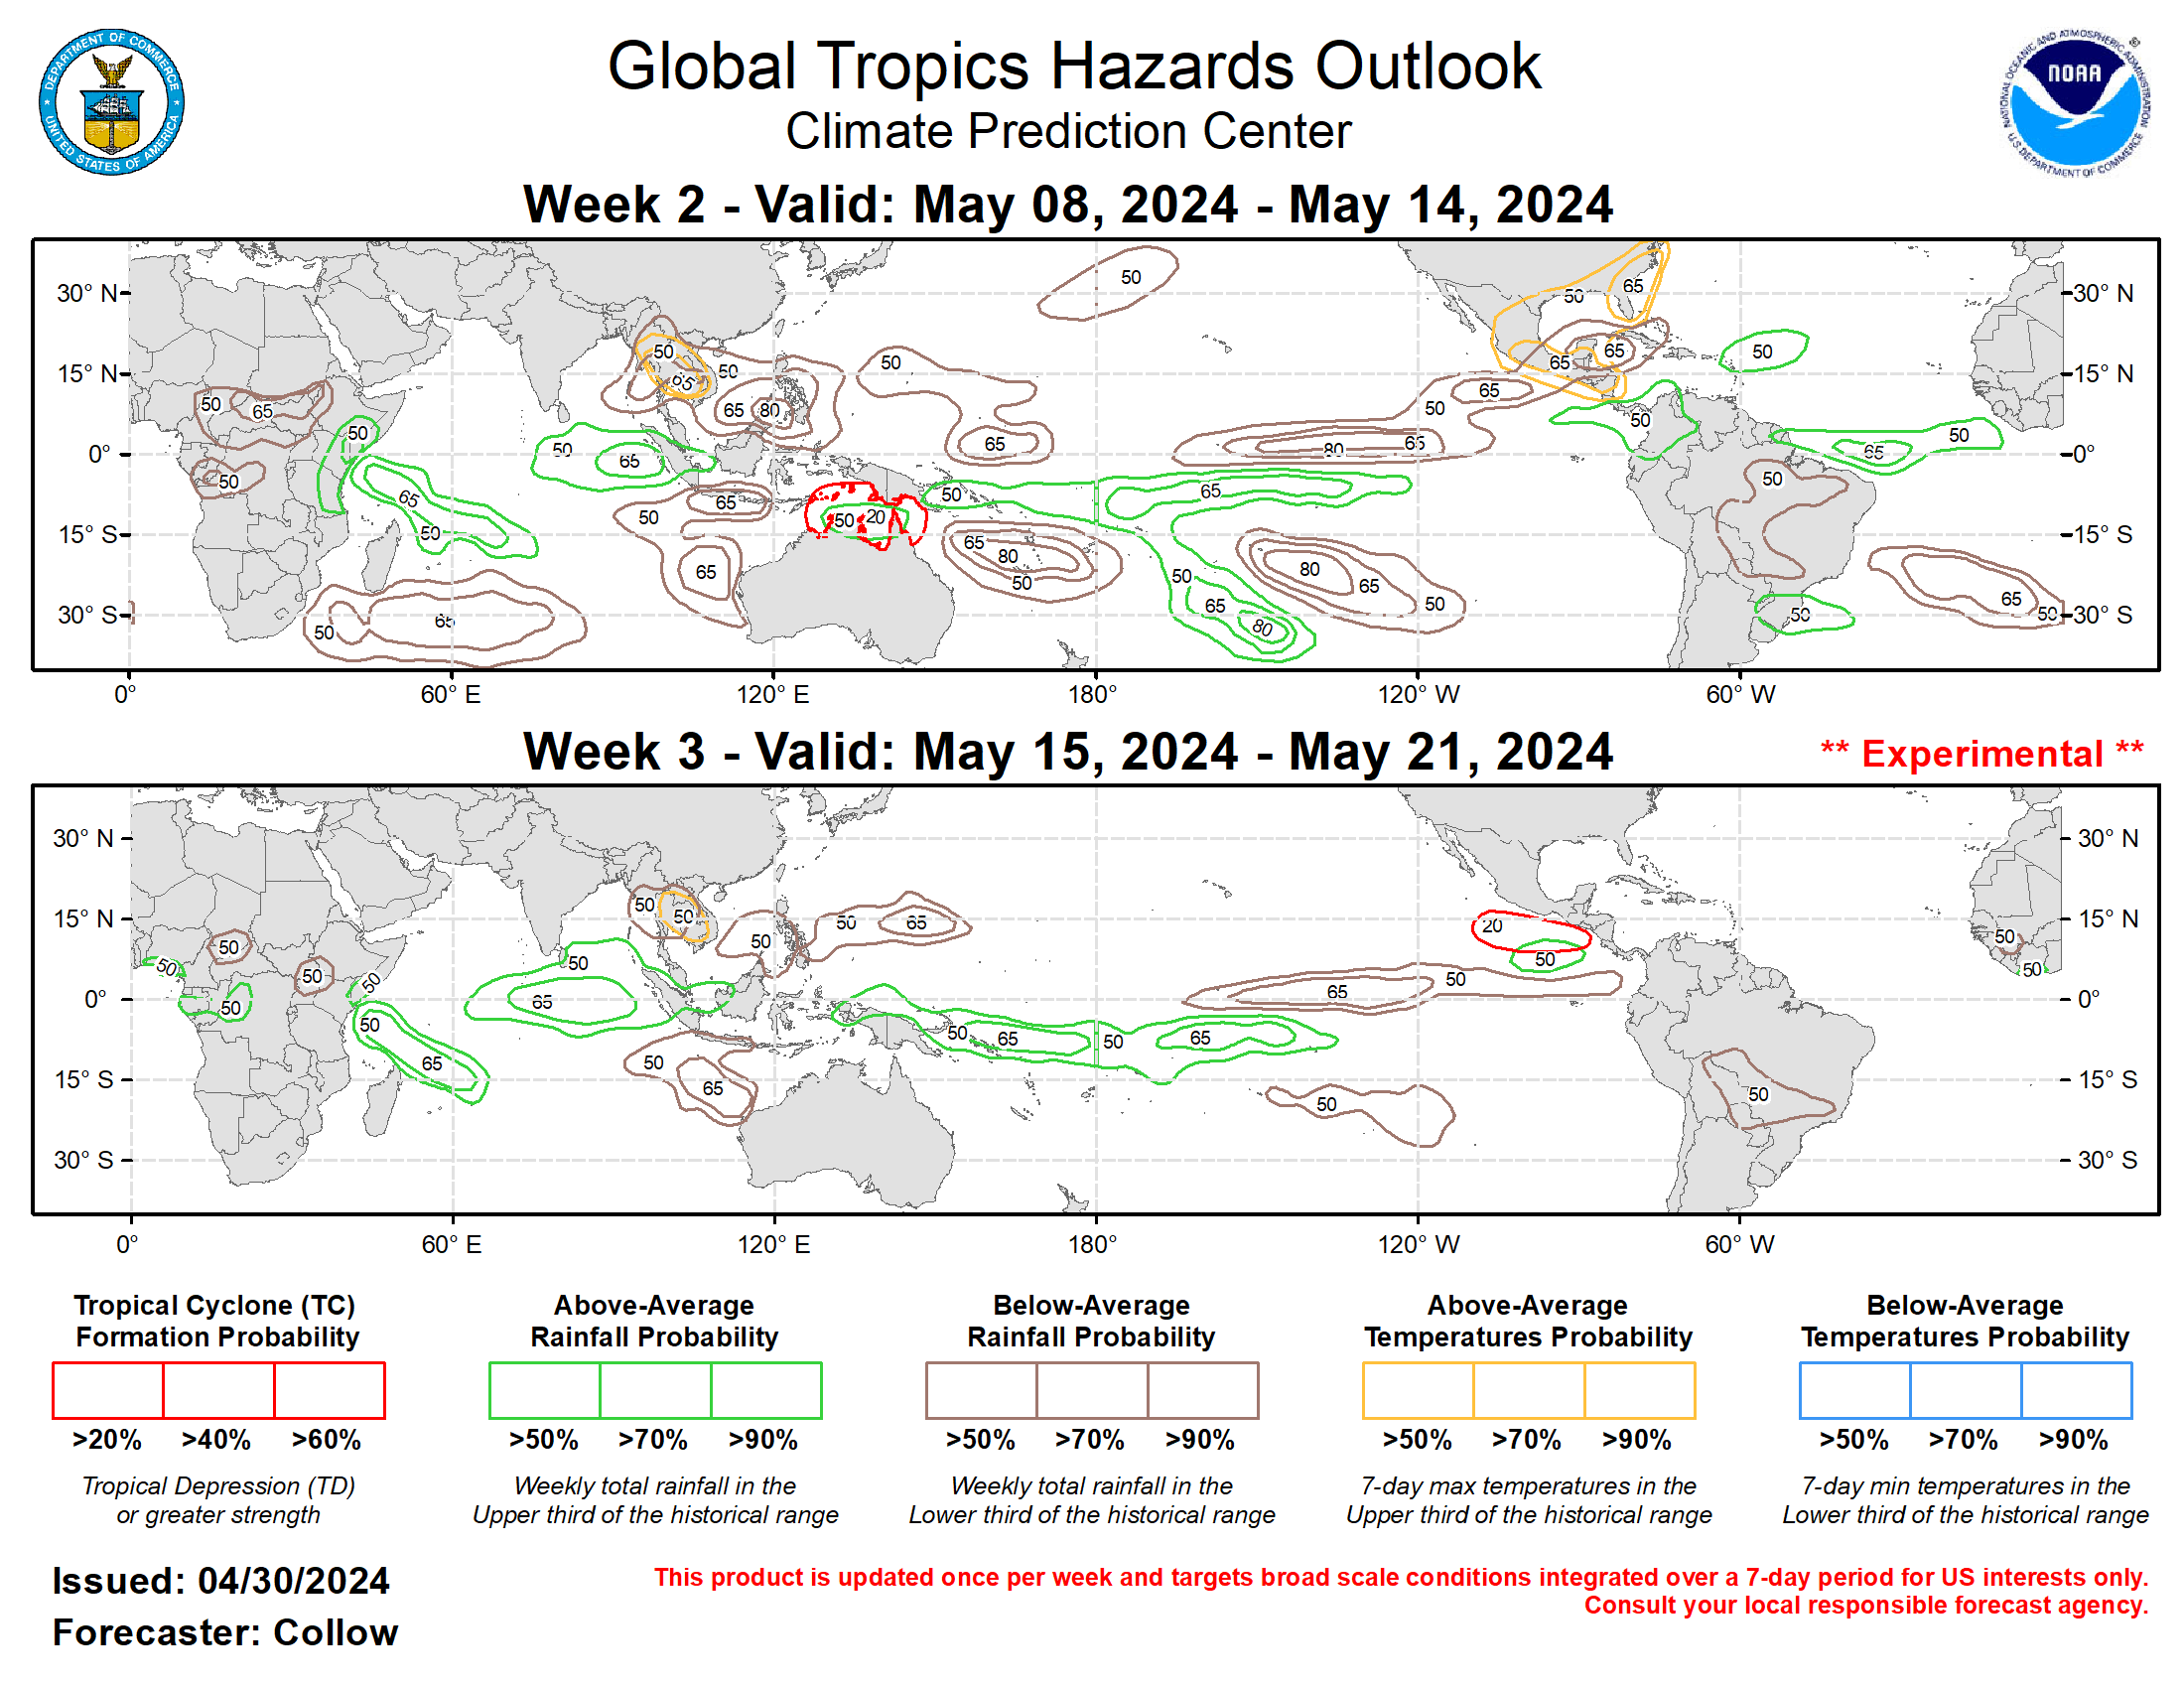
The Global Tropics Hazards Outlook is a probabilistic forecast for areas with elevated probabilities for above- or below-median rainfall, above- or below-normal
temperatures and regions where tropical cyclogenesis is favored for the upcoming Week-2 and Week-3 time periods. The rainfall outlook is for precipitation
integrated over a week and targets broad-scale patterns, not local conditions as they will be highly variable. Above (below) median rainfall forecast areas are
depicted in green and brown respectively. Above (below) normal temperature forecast areas are depicted in orange and blue respectively. Favored areas for tropical
development are shown in red. Three probability intervals are indicated for precipitation and temperature which are set at 50, 65, and 80%, while the probability
intervals for tropical cyclone development are set at 20, 40, and 60%. The weekly verification period ranges from 00 UTC Wednesday to 00 UTC the following
Wednesday.
Along with the product graphic, a written text outlook discussion is also included at release time. The narrative provides a review of the past week across
the global Tropics, a description of the current climate-weather situation, the factors and reasoning behind the depicted outlook and notes on any other
issues the user should be aware of. The discussion discusses the impacts in the Tropics as well as potential impacts in the Extratropics when relevant.
|
Product Physical Basis
The product synthesizes information and expert analysis related to climate variability across multiple time scales and from various sources, including operational
climate monitoring products. The physical basis for the outlooks include
El Nino-Southern Oscillation (ENSO) , the Madden-Julian Oscillation (MJO),
strength and variations of the monsoon systems, other coherent subseasonal tropical variability such as atmospheric Kelvin waves (KW), Equatorial Rossby waves
(ERW), African easterly waves, as well as interactions with the extratropical circulation (i.e. high latitude blocking, low-latitude frontal activity, etc.).
|
Product Forecast Tools
The outlook maps are currently based on a number of forecast tools, many of which are objective and serve as an objective first guess. The final depiction is an
assessment of these objective forecast tools augmented by the forecaster when based on additional forecast information when appropriate to create the final product.
Forecast tools include MJO composites, empirical and dynamical based MJO, ERW and KW forecasts, and bias-corrected dynamical model guidance from a number of modeling systems.
Tropical cyclone areas are based on MJO composites and statistical and dynamical tropical cyclone forecast guidance products as well as raw model forecast guidance.
|
Product Purpose
The product supports the NOAA mission in three primary ways:
- Assess and forecast important changes in the distribution of tropical convection (i.e., potential circulation changes across the Pacific and North America sectors) and communicate this information to NWS forecasters
- Provide advance notice of potential hazards related to climate, weather and hydrological events across the global tropics (including tropical cyclone risks for several NWS regions)
- Support various sectors of the U.S. economy (finance, energy, agriculture, water resource management) that have foreign interests.
|
Product Partners
The product is created through collaboration with other NOAA centers, [the National Hurricane Center (NHC) and the Central Pacific Hurricane
Center (CPHC)], the Department of Defense [The Joint Typhoon Warning Center (JTWC) and the Naval Postgraduate School (NPS)],
the Australian Bureau of Meteorology, Taiwan Central Weather Bureau, the State University of New York at Albany (SUNY) and the Center
for Climate and Satellites (CICS), among other collaborators.
|
Product Users and Applications
Known users include U.S. government agencies such as NOAA [National Weather Service (NWS), River Forecast Centers (RFCs), the National
Marine Fisheries Service (NMFS), the Department of the Interior (U.S. Forest Service), aid organizations (U.S. and international Red Cross,
USAID), domestic and global private sector interests (financial, energy, water resource management and agricultural sectors),
international weather services and various media meteorologists.
Some special applications of the product in the past include extended range predictions to support Haiti earthquake and Deepwater
Horizon oil spill relief efforts as well as support for the Dynamics of the MJO (DYNAMO) scientific field campaign held from
October 2011 through March 2012.
|
Product Resources
|
|
Feedback and Questions
|
|


