|
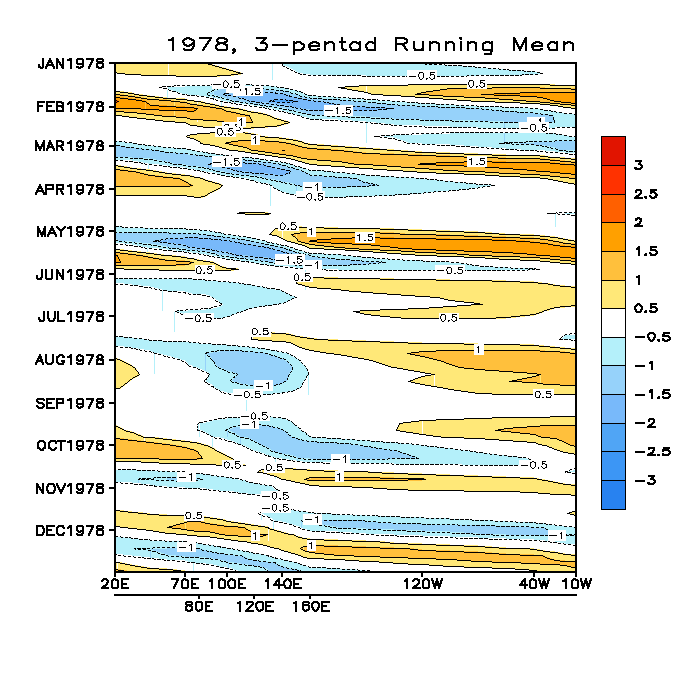
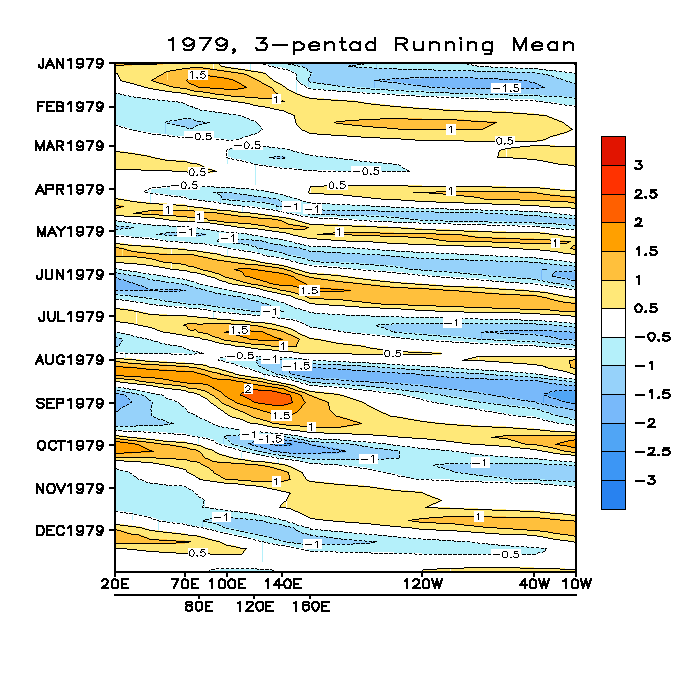
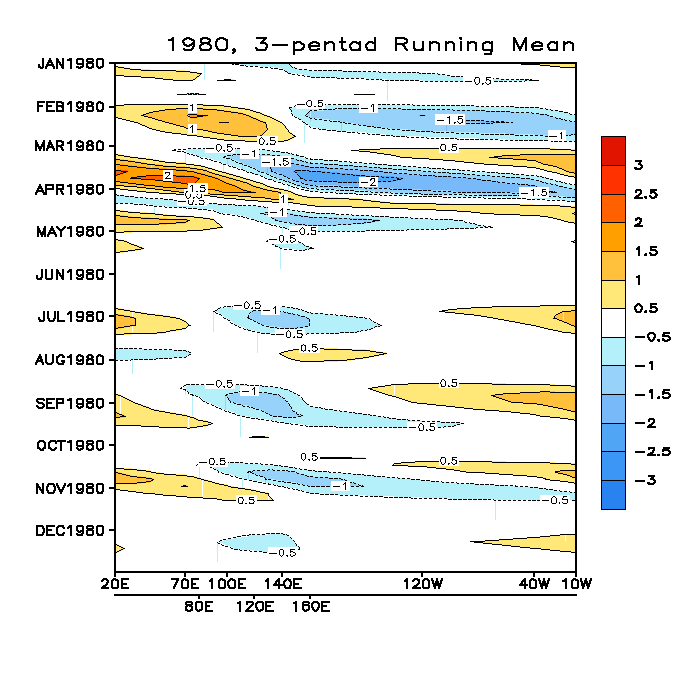
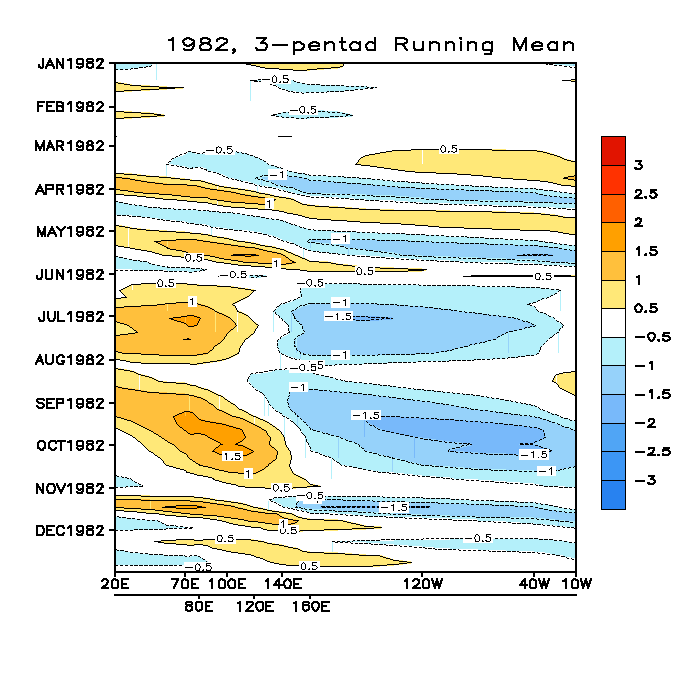
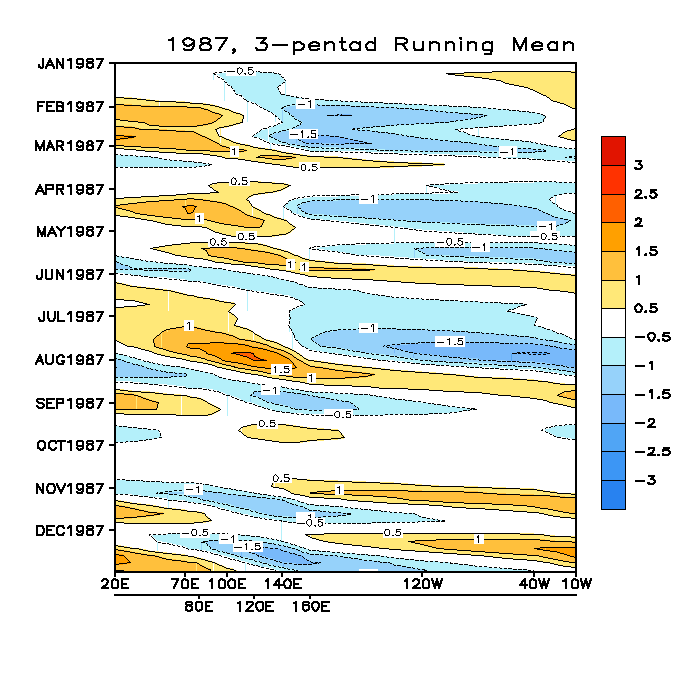
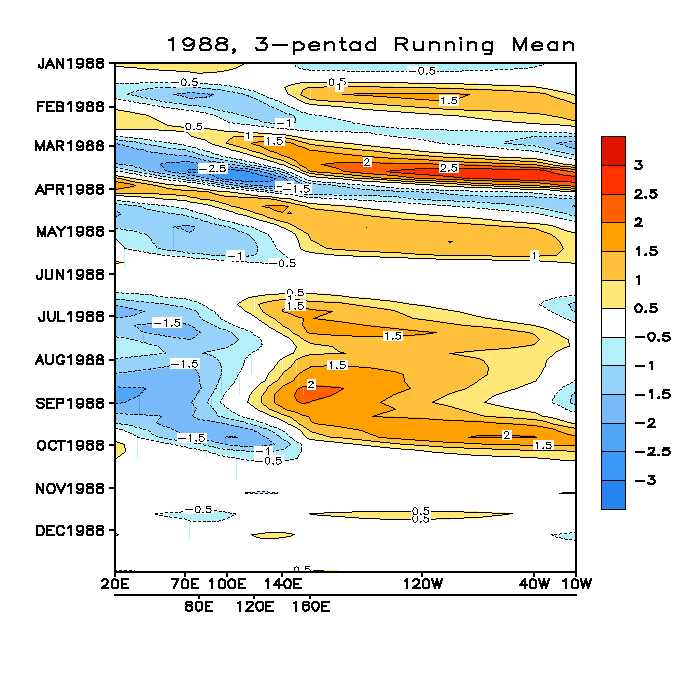
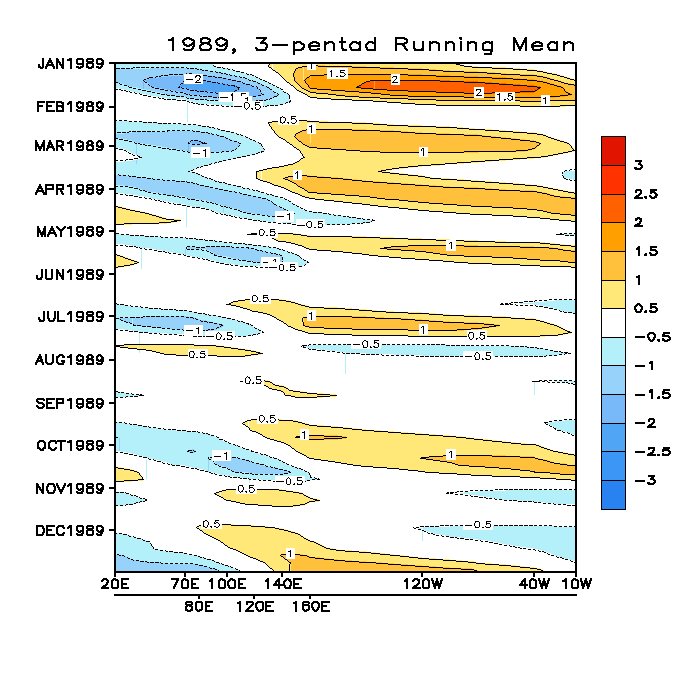
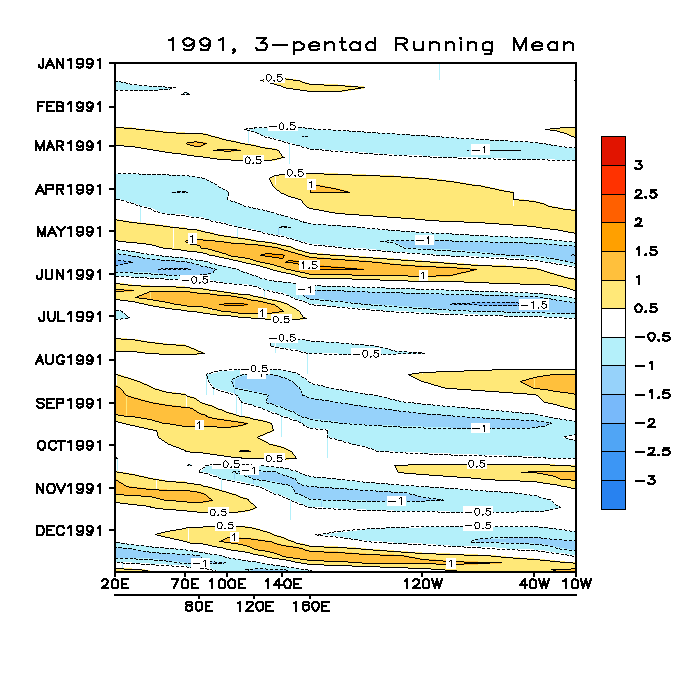
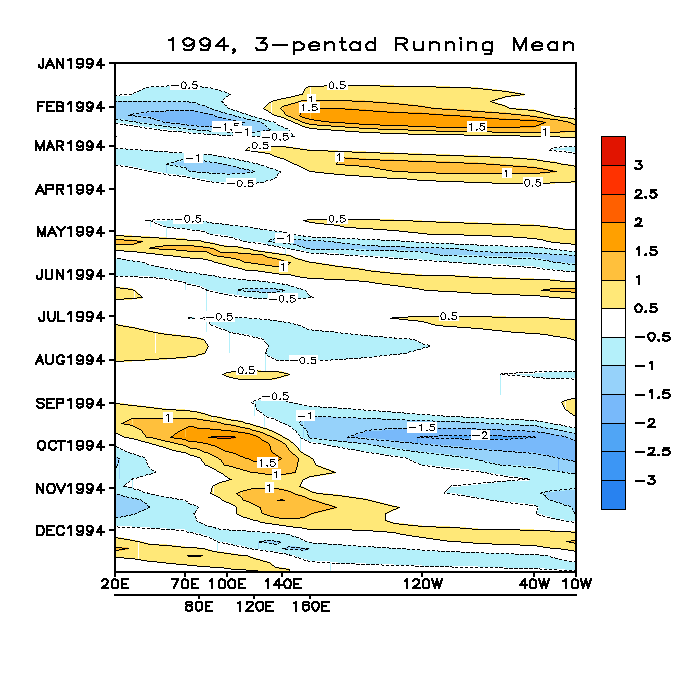
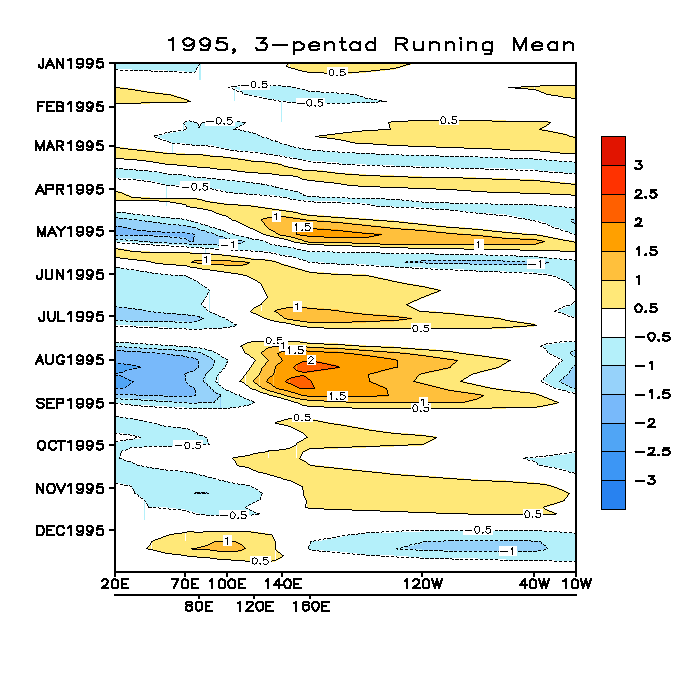
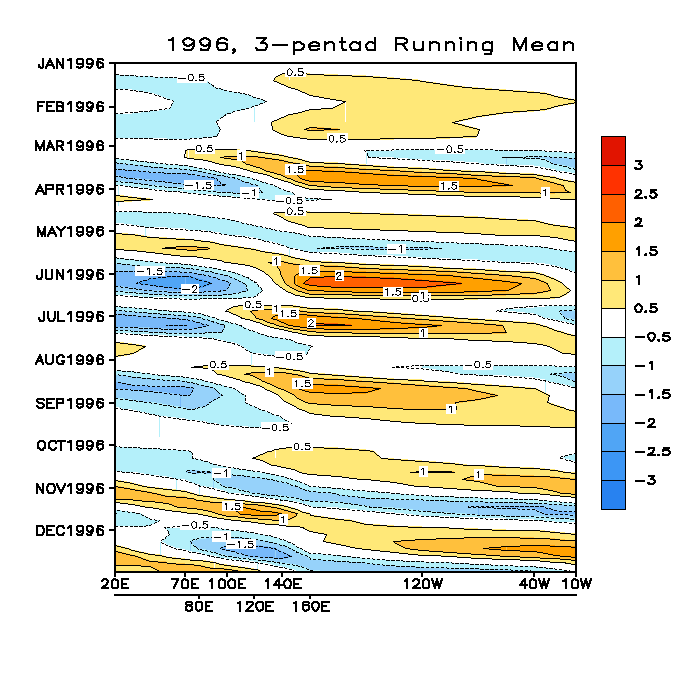
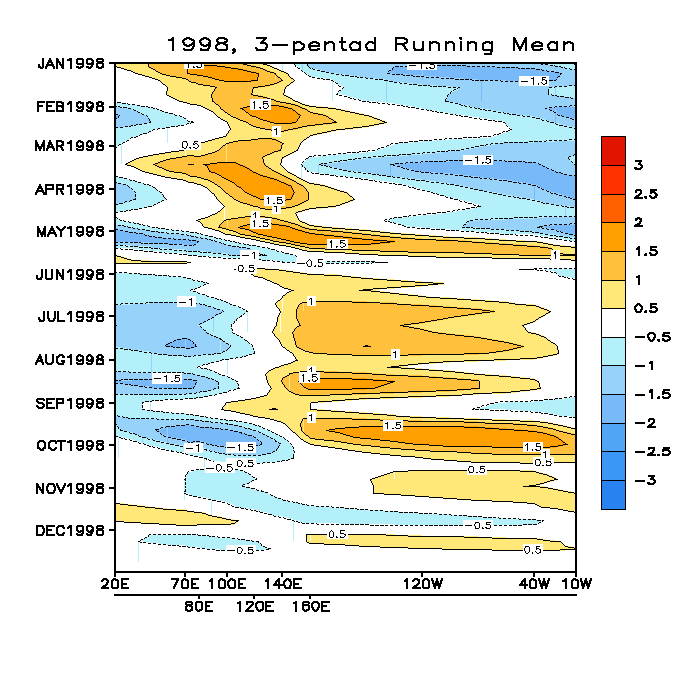
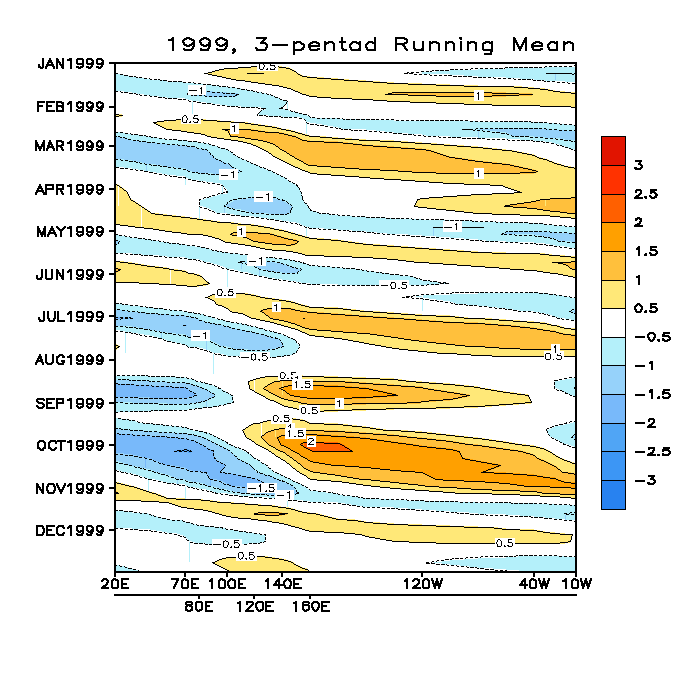
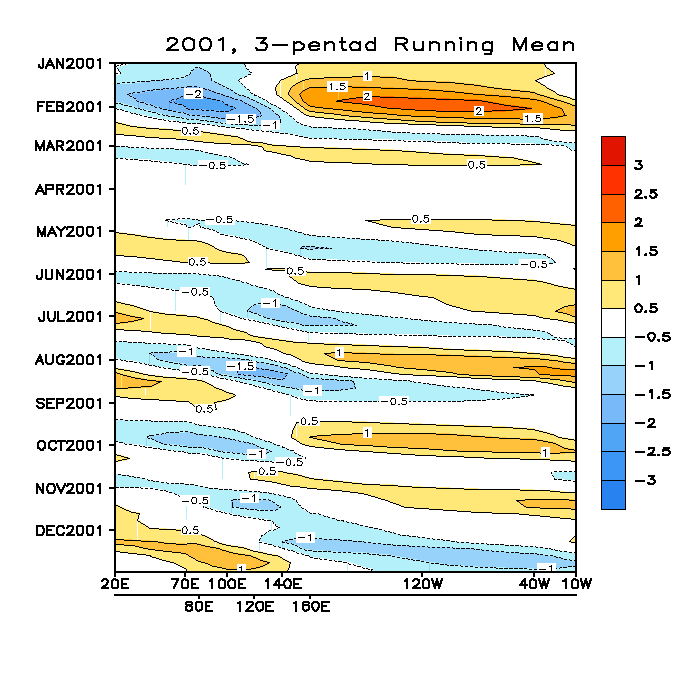
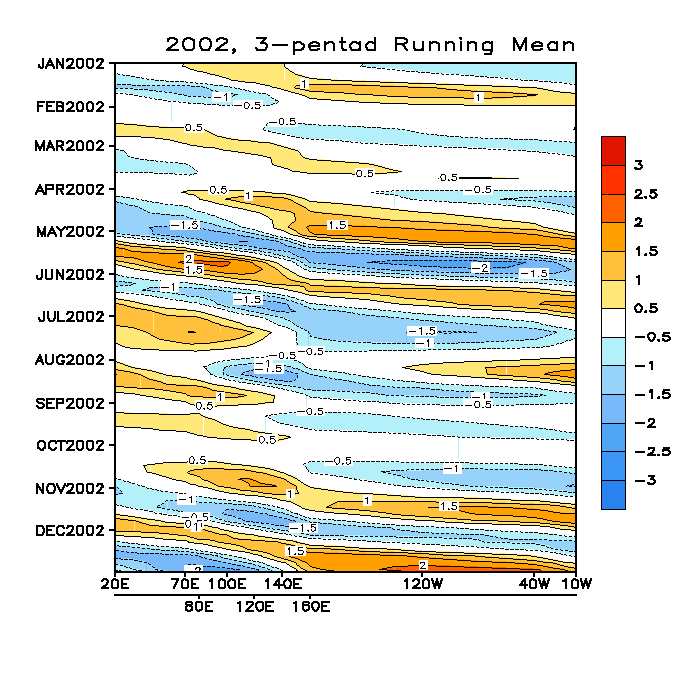
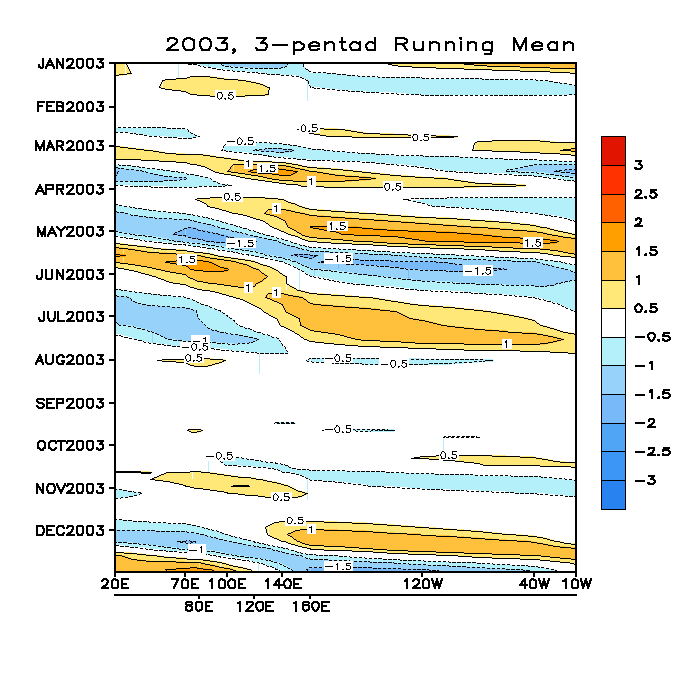
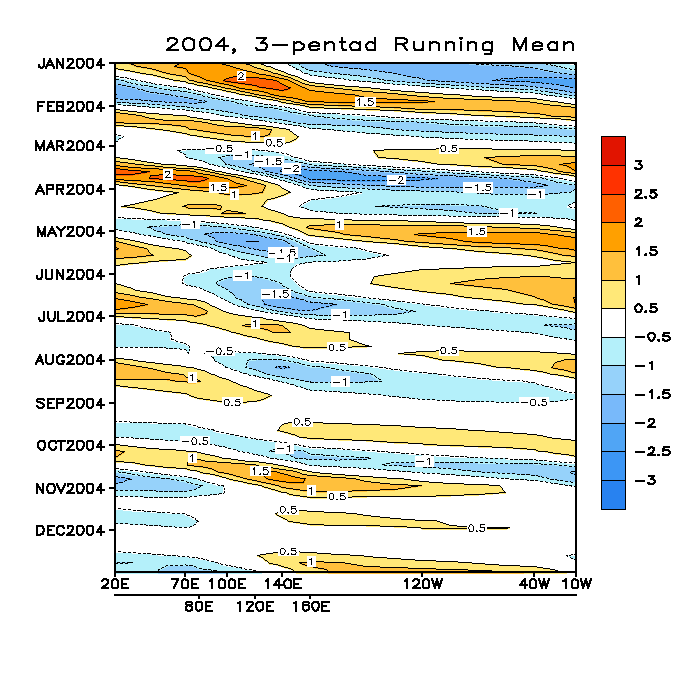
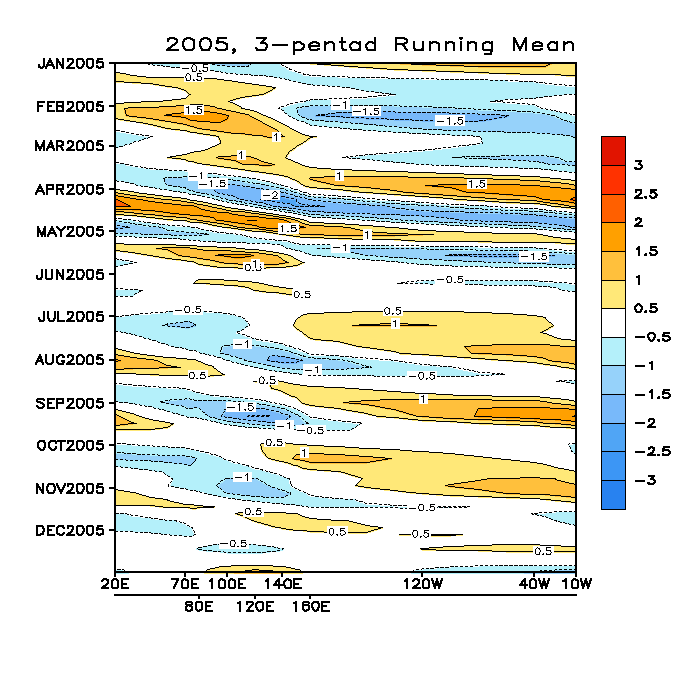
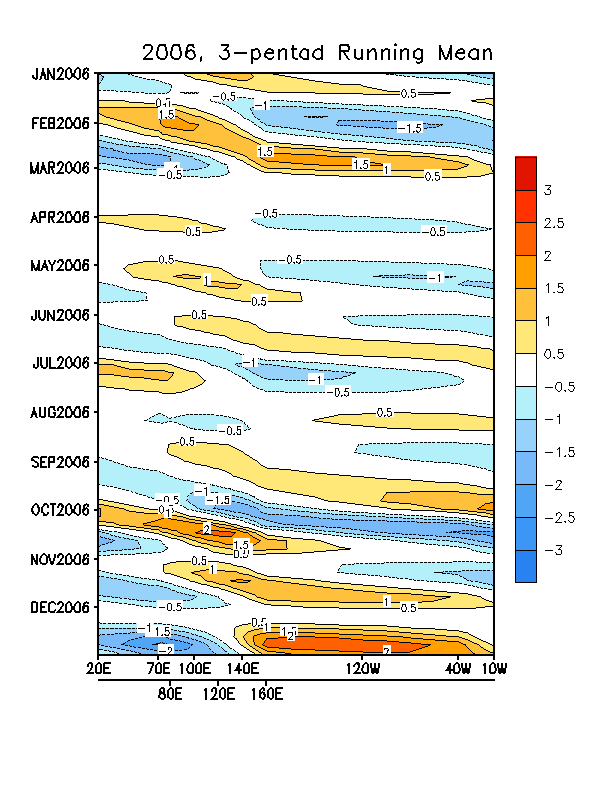
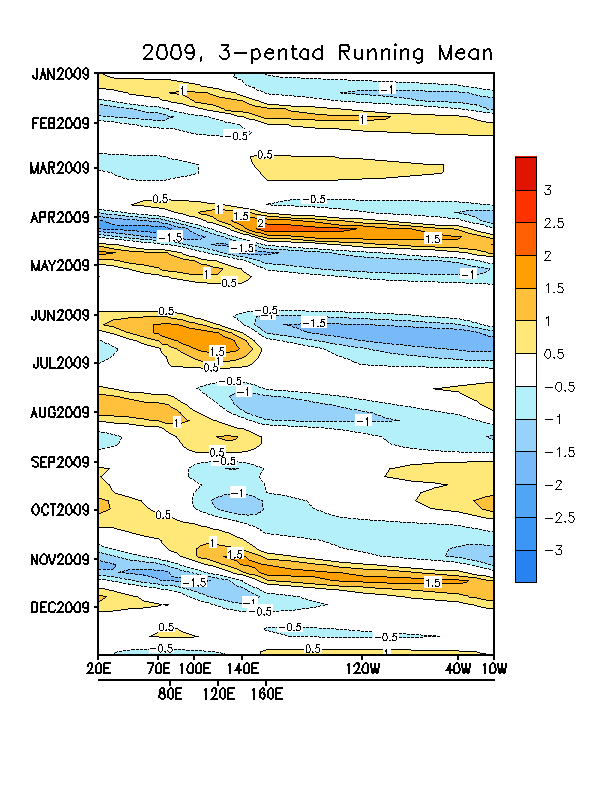
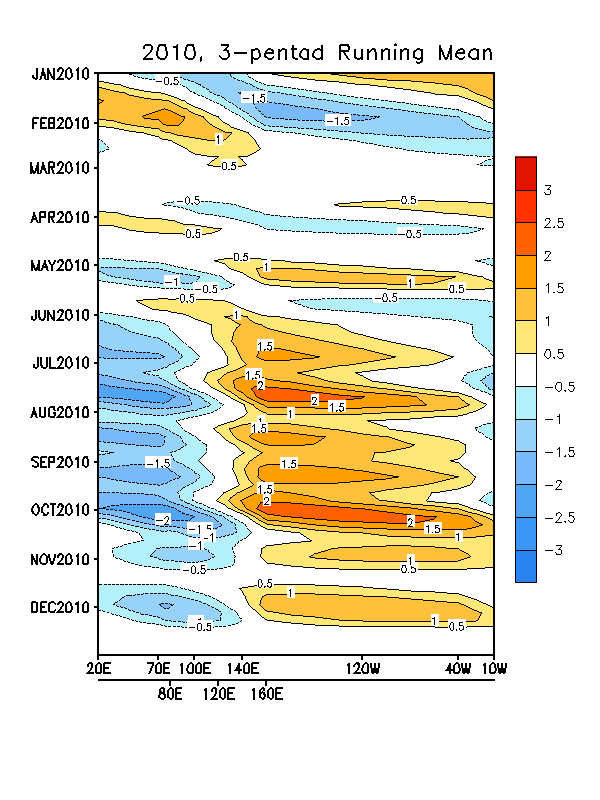
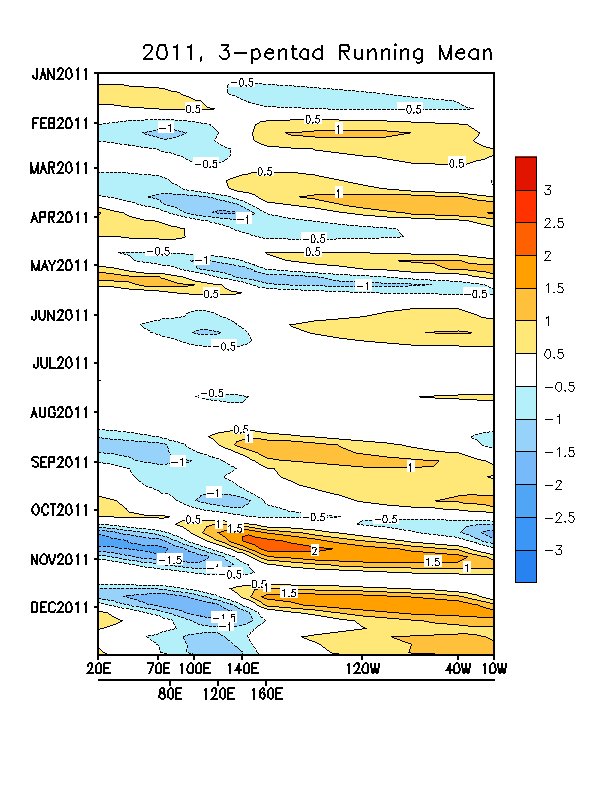
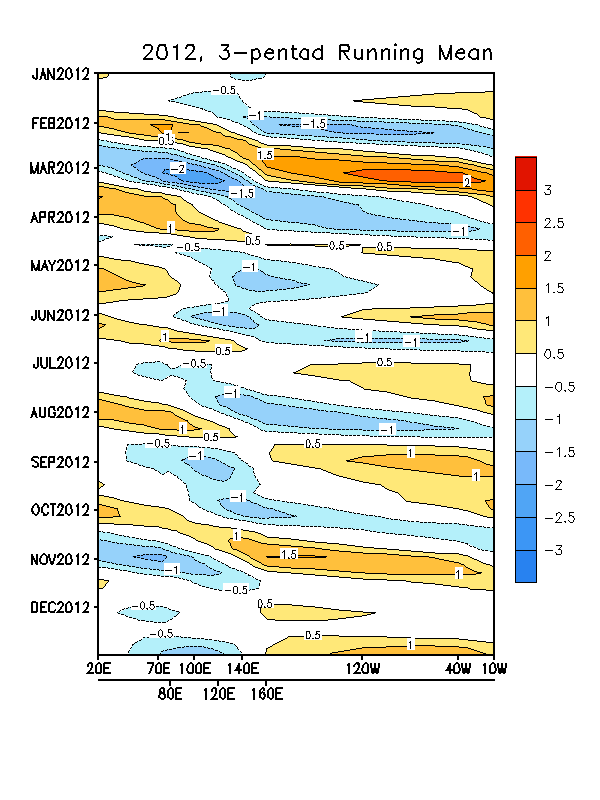
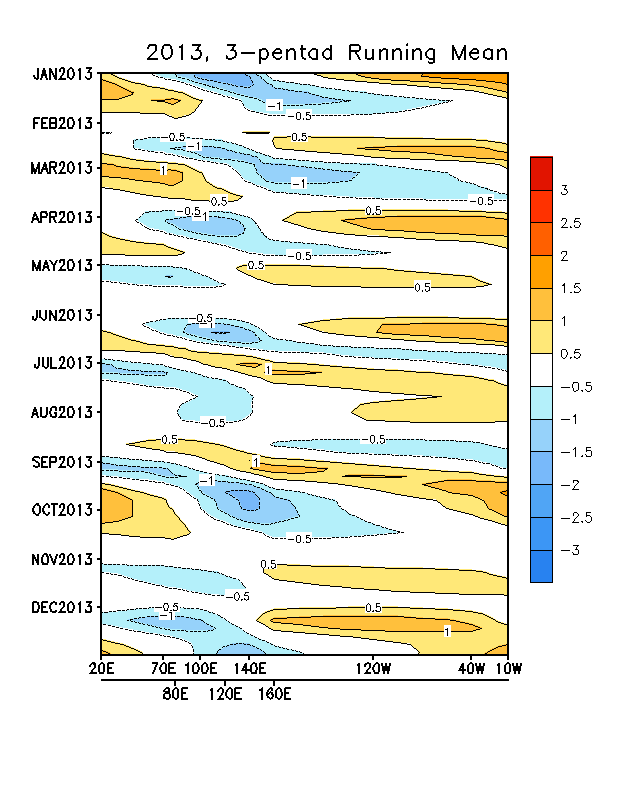
Extended Empirical Orthogonal Function (EEOF) analysis is applied to pentad 200-hPa velocity potential (CHI200) anomalies equatorward of 30°N during ENSO-neutral and weak ENSO winters (November-April) in 1979-2000. See CPC ENSO classification .
Ten MJO indices are the minus projection of the pentad CHI200 anomalies onto the ten time-lagged patterns of the first EEOF of pentad CHI200 anomalies.
Anomalies are based on the 1979-1995 period, and each index is normalized by its standard deviation during ENSO-neutral and weak ENSO winters (November-April) in 1979-2000.
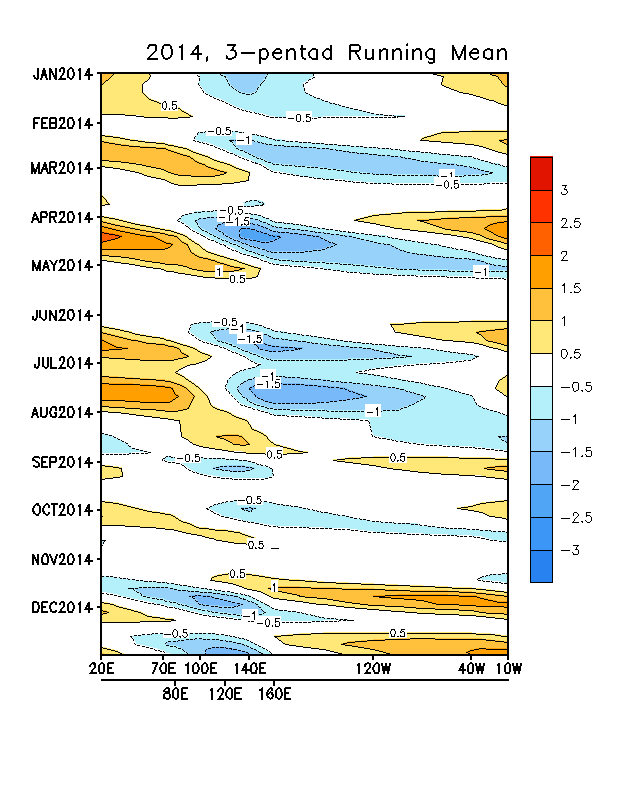
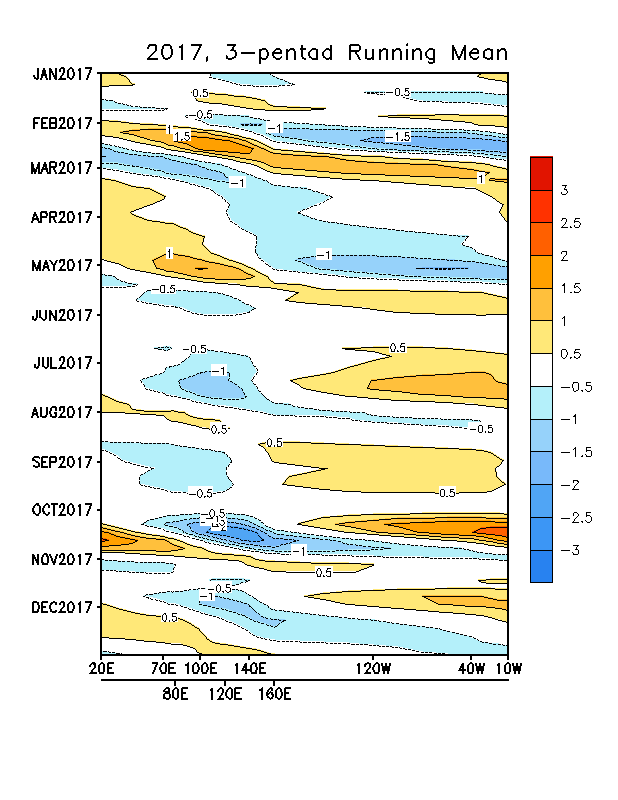
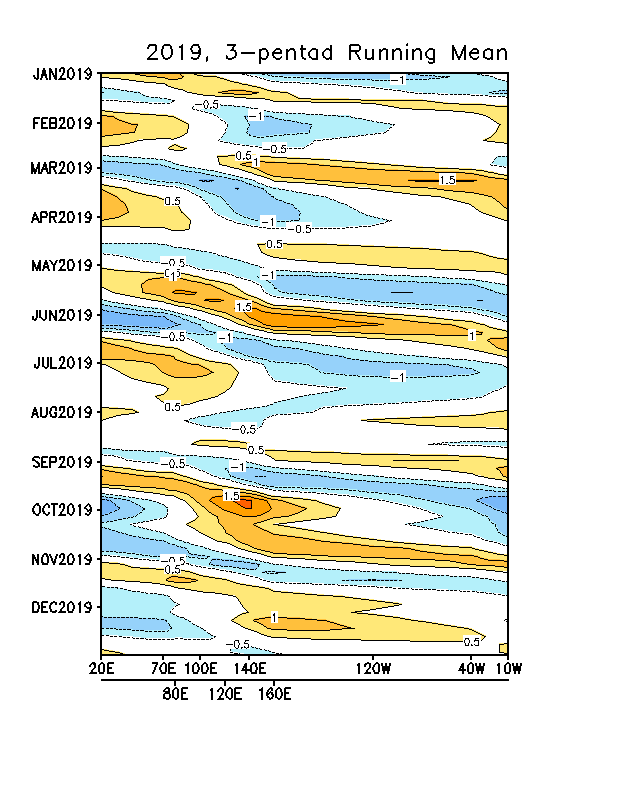
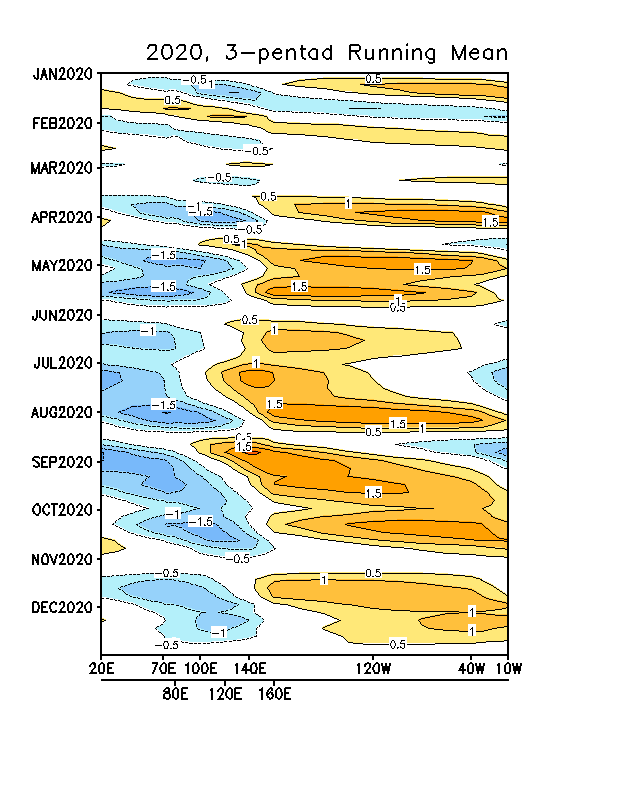
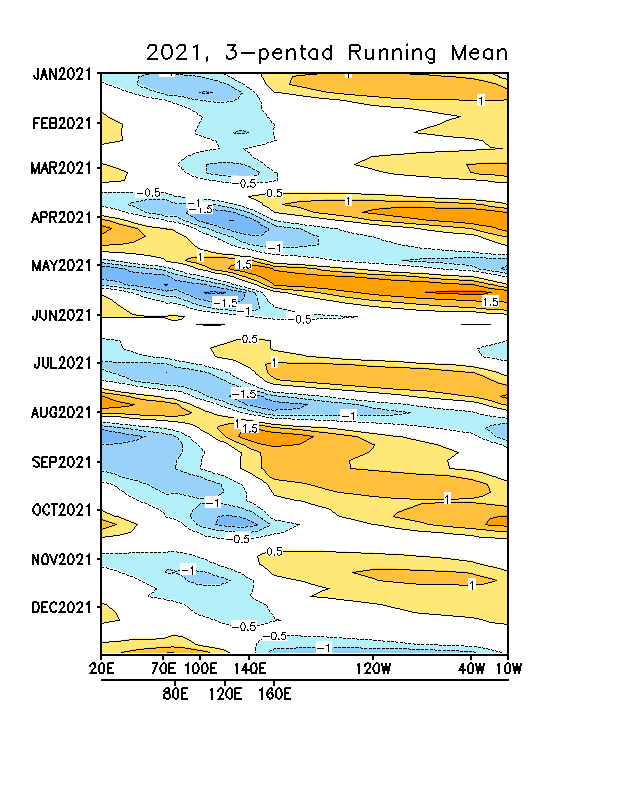
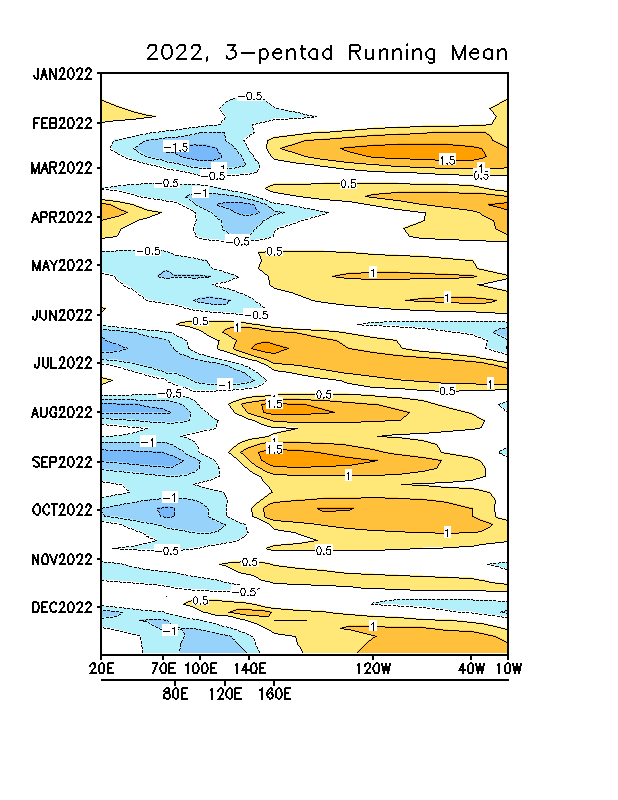
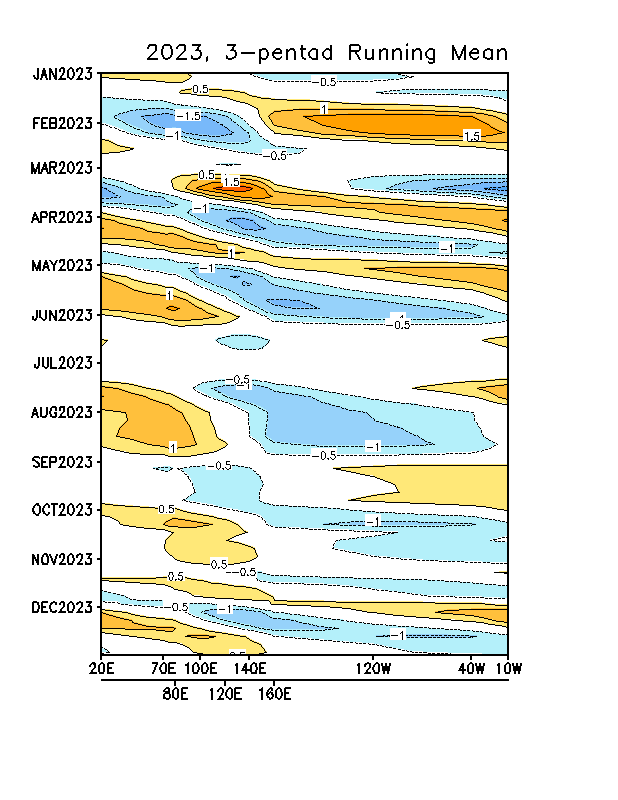
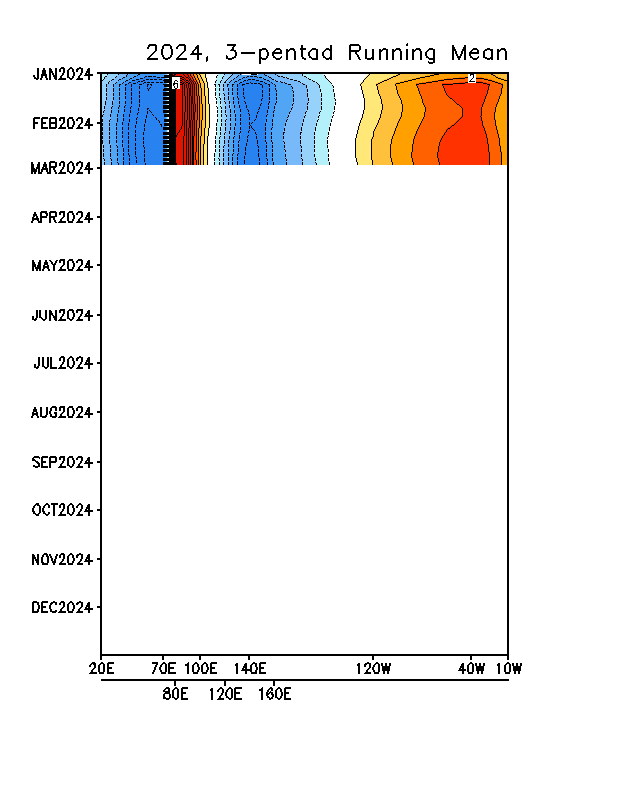
Pentad MJO indices since 1978:
- Graphical format (click each year in the following table)
Note that the blueish (reddish) color represents the enhanced (suppressed ) convection, and the x-axis labels the centers (20°E, 70°E, 80°E, 100°E, 120°E,
140°E, 160°E, 120°W, 40°W and 10°W) of enhanced convection for the ten indices, which are determined from the ten time-lagged patterns of the first EEOF of CHI200.
|


