|
| |
|
HOME > El Nino/La Nina Home > U.S. ENSO Temperature & Precipitation Composites > Clickable Maps
|
| |
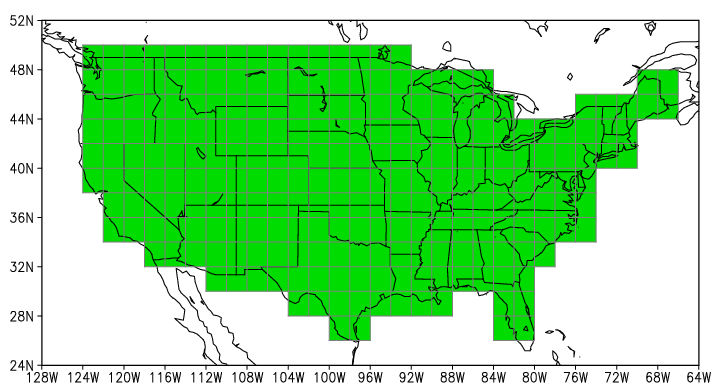
La Niña: Trend Adjusted Precipitation
|
| Click on each 2X2 degree grid box to display the percentage of La Niña events in each trend adjusted precipitation tercile. The number in parenthesis on each panel is the number of La Niña events for that season based on 1950-2002. Results are based on the average of grid points within the box.
|
|
|


