The updated 2022 Atlantic Hurricane Season Outlook is an official product of the National Oceanic and Atmospheric Administration (NOAA) Climate Prediction Center (CPC). The outlook is produced in collaboration with hurricane experts from the National Hurricane Center (NHC) and the Hurricane Research Division (HRD). The Atlantic hurricane region includes the North Atlantic Ocean, Caribbean Sea, and Gulf of Mexico.
Interpretation of NOAA's Atlantic hurricane season outlook:
This outlook is a general guide to the expected overall activity during the upcoming hurricane season. It is not a seasonal hurricane landfall forecast, and it does not predict levels of activity for any particular location.
Preparedness:
Hurricane-related disasters can occur whether the season is active or relatively quiet. It only takes one hurricane (or tropical storm) to cause a disaster. It is crucial that residents, businesses, and government agencies of coastal and near-coastal regions prepare for every hurricane season regardless of this, or any other, seasonal outlook. The Federal Emergency Management Agency (FEMA), the National Hurricane Center (NHC), the Small Business Administration, and the American Red Cross all provide important hurricane preparedness information on their web sites.
NOAA does not make seasonal hurricane landfall predictions:
NOAA does not make seasonal hurricane landfall predictions. Hurricane landfalls are largely determined by the weather patterns in place as the hurricane approaches, and those patterns are only predictable when the storm is within several days of making landfall.
Nature of this outlook and the "likely" ranges of activity:
This outlook is probabilistic, meaning the stated "likely" ranges of activity have a certain likelihood of occurring. The seasonal activity is expected to fall within these ranges in 7 out of 10 seasons with similar climate conditions and uncertainties to those expected this year. They do not represent the total possible ranges of activity seen in past similar years.
This outlook is based on 1) predictions of large-scale climate factors known to influence seasonal hurricane activity, and 2) climate forecast models that directly predict seasonal hurricane activity. This outlook also takes into account uncertainties inherent in such climate outlooks.
Preparedness for tropical storm and hurricane landfalls:
It only takes one storm hitting an area to cause a disaster, regardless of the overall activity for the season. Therefore, residents, businesses, and government agencies of coastal and near-coastal regions are urged to prepare every hurricane season regardless of this, or any other, seasonal outlook.
Sources of uncertainty in the seasonal outlooks:
-
Will the current La Niña event reinforce the conditions that are conducive for tropical cyclone development across the Atlantic Main Development Region? Will the impact align with historical impacts? Will it be disrupted by intraseasonal processes? Predicting El Niño and La Niña events (also called the El Niño-Southern Oscillation, or ENSO) and their impacts on Atlantic hurricane activity is an ongoing scientific challenge facing climate scientists today. Such forecasts often have limited skill, especially when border-line El Niño or La Niña events are predicted.
-
Many combinations of named storms and hurricanes can occur for the same general set of climate conditions. For example, one cannot know with certainty whether a given climate signal will be associated with several shorter-lived storms or fewer longer-lived storms with greater intensity.
-
Model predictions of various factors known to influence seasonal hurricane activity in the Atlantic region, such as sea surface temperatures (SSTs), vertical wind shear, moisture, and atmospheric stability are still showing some spread for August-October (ASO), the peak months of the hurricane season, and it is unclear as to exactly how conducive these conditions will be for tropical cyclone development.
-
Weather and subseasonal patterns that are unpredictable on seasonal time scales can sometimes develop and last for weeks or months, possibly affecting seasonal hurricane activity.
2022 Atlantic Hurricane Season Outlook Summary
a. Predicted Activity
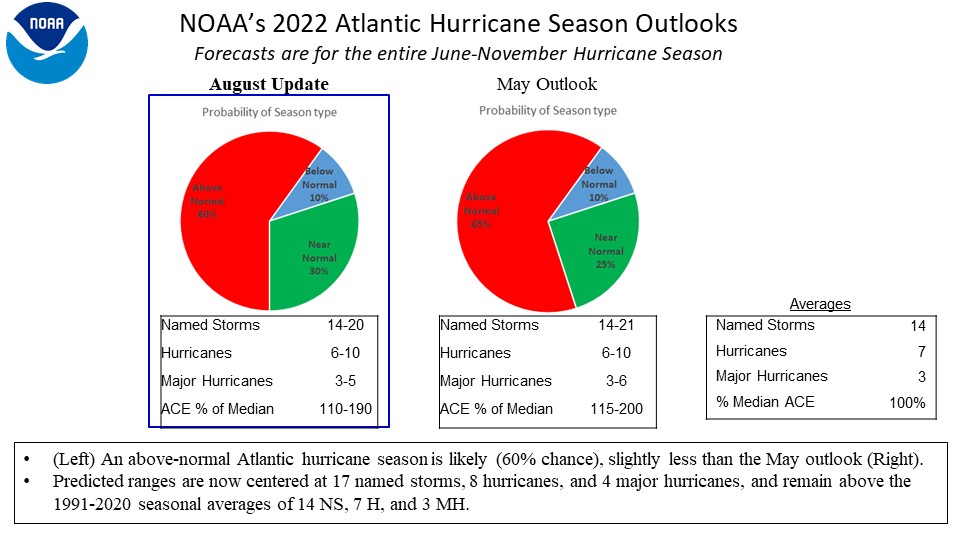
NOAA’s updated 2022 Atlantic Hurricane Season Outlook indicates that an above-normal season is most likely, with a possibility the season could be extremely (aka hyper-) active. The outlook calls for a 60% chance of an above-normal season, followed by a 30% chance of a near-normal season, and only a 10% chance of a below-normal season. See NOAA definitions of above-, near-, and below-normal seasons. The Atlantic hurricane region includes the North Atlantic Ocean, Caribbean Sea, and Gulf of Mexico.
The updated 2022 outlook calls for a 70% probability for each of the following ranges of activity during the 2022 hurricane season, which officially runs from June 1st through November 30th:
- 14-20 Named Storms, which includes the three recorded storms during June and July
- 6-10 Hurricanes
- 3-5 Major Hurricanes
- Accumulated Cyclone Energy (ACE) range of 110%-190% of the median, which includes the ACE from the three recorded named storms
The activity is expected to fall within these ranges in 70% of seasons with similar climate conditions and uncertainties to those expected this year. These ranges do not represent the total possible activity seen in past similar years.
The season is expected to produce above-average numbers of tropical storms, hurricanes, and major hurricanes. The centers of the predicted ranges of named storms, hurricanes, and major hurricanes (17, 8, and 4, respectively) are above the 1991-2020 seasonal averages of about 14 named storms, 7 hurricanes, and 3 major hurricanes.
Compared to the May outlook, the August update has several very slight decreases in the prediction of overall activity. There is just a slight decrease in the probability of above-normal activity (65% reduced to 60%) and a slight increase in the chances for a near-normal season (25% increased to 30%) The forecast ranges for likely seasonal counts of named storms decreased by 1 on the upper end. The updated outlook indicates an upper bound of only 5, down one from the upper bound of 6, in the May Outlook for the potential number of major hurricanes. The range of predicted ACE tightened slightly, since major hurricanes contribute significantly to the ACE.
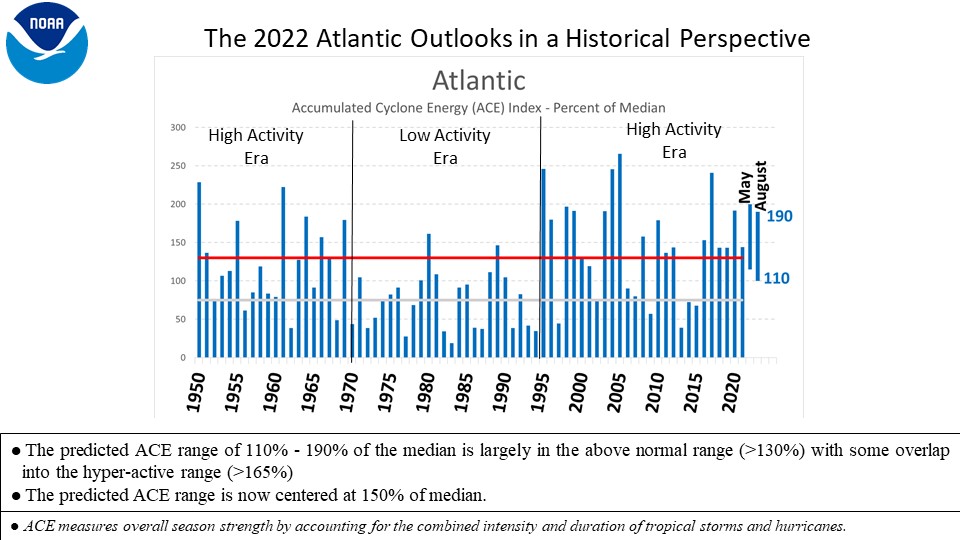
The ACE index measures the combined intensity and duration of all tropical storms and hurricanes during the season. NOAA uses this robust measure of overall seasonal activity to help classify hurricane season strength. The predicted ACE range is centered in the above-normal/active range. The range extends from the near-normal category (75-130% of median) into the above-normal category, and even exceeds the threshold for an extremely-active season (>165% of median).
b. Reasoning behind the outlook
The updated 2022 seasonal hurricane outlook reflects the expectation of either non-competing or reinforcing climate factors during August-October (ASO), and these factors historically produce Atlantic hurricane seasons with above-normal activity. The main climate factors for this outlook are:
-
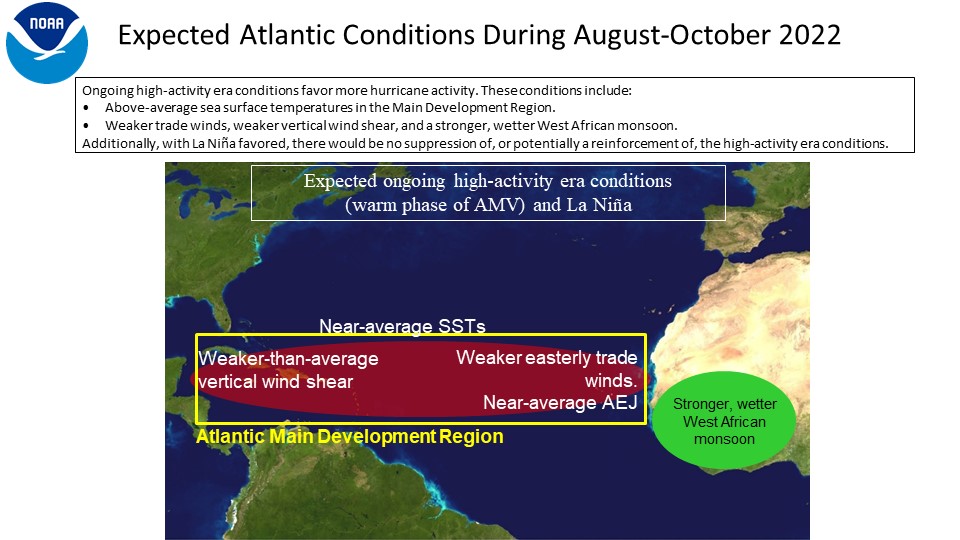
The set of conditions that have produced the ongoing high-activity era for Atlantic hurricanes which began in 1995 are likely to continue in 2022. These conditions include warmer sea-surface temperatures (SSTs) and weaker trade winds in the Atlantic hurricane Main Development Region (MDR), along with weaker vertical wind shear and an enhanced West African monsoon. The MDR spans the tropical North Atlantic Ocean and Caribbean Sea (Goldenberg and Shapiro 1996).
-
The most recent forecast from the NOAA Climate Prediction Center indicates La Niña conditions are likely through the hurricane season. The odds are highest for La Niña (62%), followed by ENSO-neutral (36%), and a very low chance of an El Niño event (2%). During a high-activity era, ENSO-neutral is typically associated with above-average levels of activity. La Niña tends to reinforce those high-activity era conditions and further increases the likelihood of an above-normal season with activity near the upper ends of the predicted ranges.
DISCUSSION
1. Expected 2022 activity
NOAA's updated outlook for the 2022 Atlantic Hurricane Season indicates that an above-normal season is most likely (60% chance), with the possibility of it being extremely (aka hyper-) active. The outlook also includes a 30% chance of a near-normal season, and only 10% chance of a below-normal season.
The total seasonal activity is measured by NOAA’s Accumulated Cyclone Energy (ACE) index, which accounts for the combined intensity and duration of all named storms and hurricanes during the season. This outlook indicates a 70% chance that the 2022 seasonal ACE range will be 110%-190% of the median. This activity is slightly below the prediction from May of 2022 (115%-200% of the median ACE). Also, the updated ACE range is centered at 150% of median, which is above NOAA’s threshold (130% of median) for an above-normal season. Therefore, 2022 is favored to extend the record of consecutive above-normal seasons to seven.
The 2022 Atlantic hurricane season is now predicted to produce (with 70% probability for each range) a total of 14-20 named storms (which includes the three named storms to date), of which 6-10 are expected to become hurricanes, with 3-5 of these expected to become major hurricanes. These ranges are centered above the 1991-2020 averages of about 14 named storms, 7 hurricanes and 3 major hurricanes.
Predicting the location, number, timing, and strength of tropical storm and hurricane landfalls are ultimately related to the daily weather patterns, storm genesis locations, and steering patterns. These patterns are not predictable weeks or months in advance. As a result, it is not possible to reliably predict the number or intensity of landfalling storms in a seasonal outlook, or whether a given locality will be impacted by a hurricane this season. Therefore, residents, businesses, and government agencies of coastal and near-coastal regions are urged to prepare every hurricane season regardless of this, or any other, seasonal outlook.
2. Science behind the Outlook
NOAA’s updated 2022 Atlantic hurricane season outlook reflects competing factors, most of which support an above-normal season, but some point to more moderate outcomes.
-
Atmospheric conditions now present within the Main Development Region (MDR) are generally conducive for hurricane development, and some of these conditions are predicted to last through the peak months of the hurricane season (August-October). The MDR spans the tropical Atlantic Ocean and Caribbean Sea (Goldenberg and Shapiro 1996). The underlying climate factor for these conditions is the ongoing Atlantic high-activity era, which began in 1995 in association with a transition to the warm phase of the Atlantic Multidecadal Variability (AMV) (Goldenberg et al. 2001, Bell and Chelliah 2006, Klotzbach and Gray 2008).
-
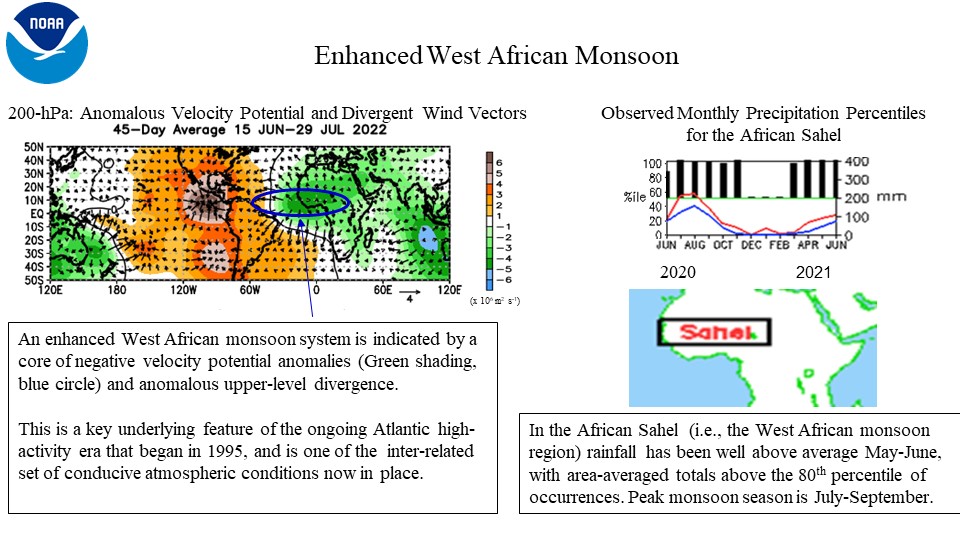
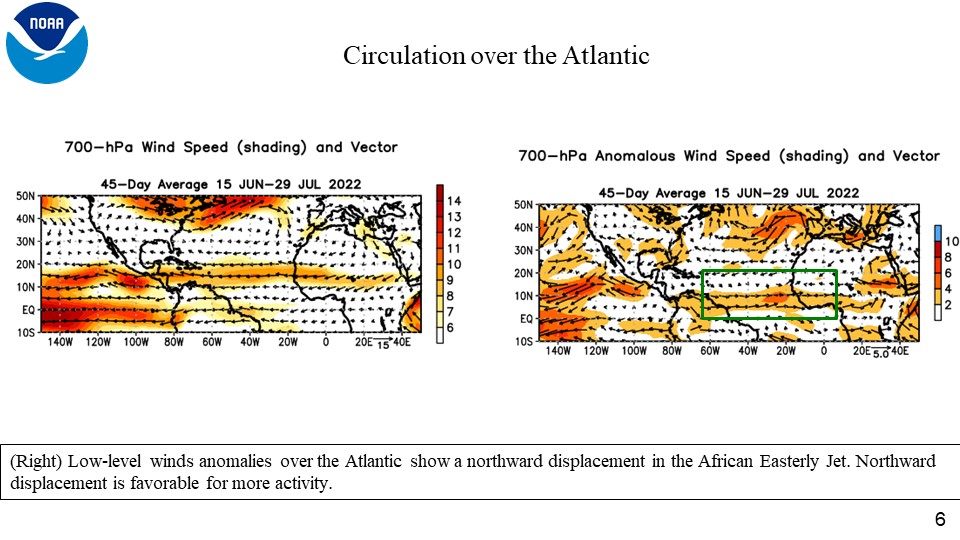
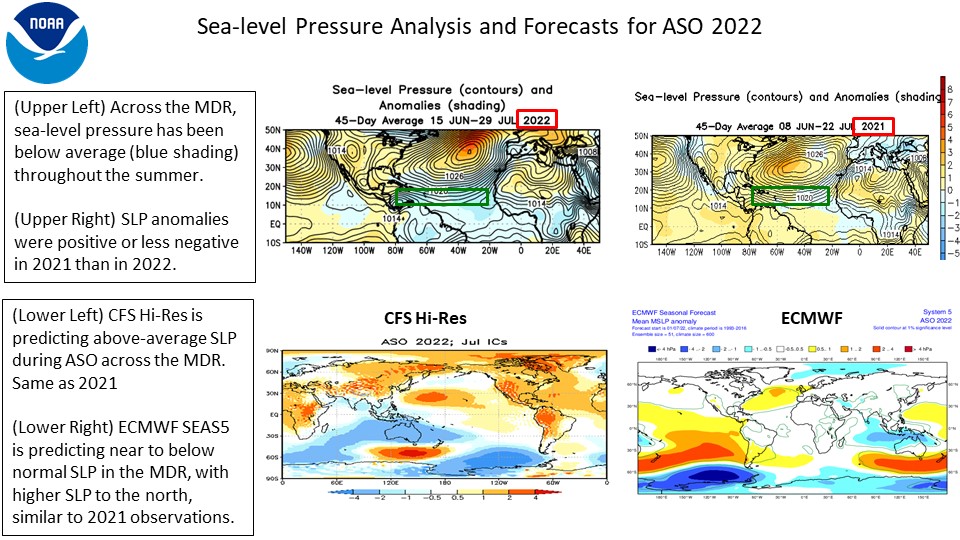
The West African Monsoon has been stronger than average with rains in June near the 80th percentile of historical observations. Additionally, the African Easterly Jet, as assessed at 700-hPa, has been shifted northward , but not as far northward as last year. A northward shift is favorable for tropical storm and hurricane formation, with a shift further north being more favorable. Additionally, sea-level pressure analyses indicate that pressures are generally below normal across the MDR.
-
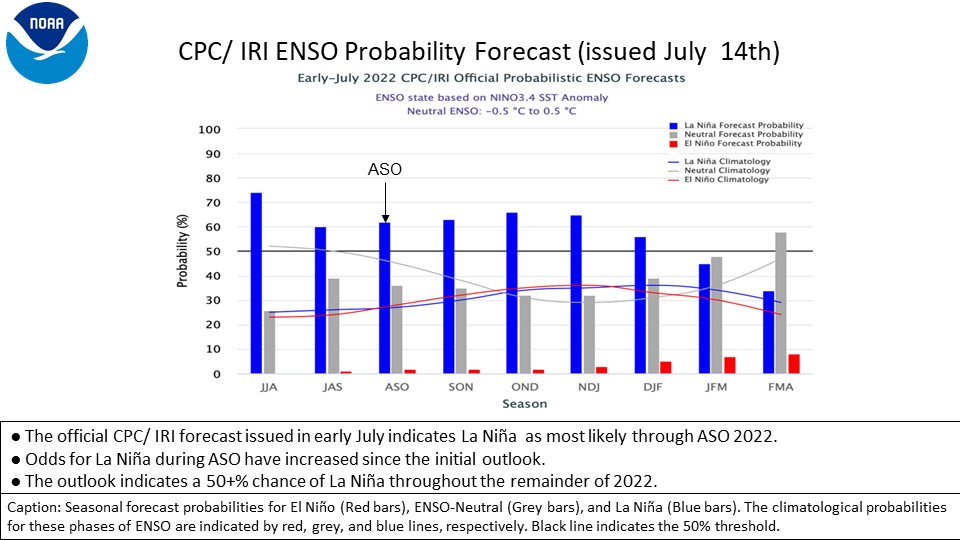
There is about a 62% chance of La Niña during August-September-October (ASO), and virtually no chance that El Niño will develop and suppress the hurricane activity this season. The combination of La Niña and a warm phase of the AMV typically results in weaker vertical wind shear in the MDR, which favors more activity. Currently, La Niña is being observed over the tropical Pacific, and the official outlook suggests the La Niña will persist throughout the Atlantic hurricane season.
-
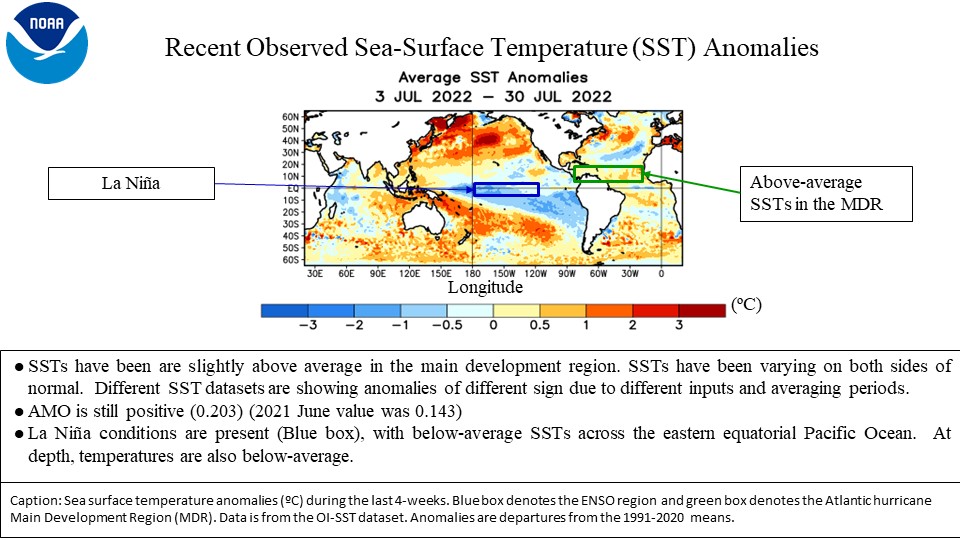
Some observed conditions are not as supportive of an active season.SSTs in the MDR are slightly above normal during the past 4 weeks, but have been below average for some periods during the past 2 months. The comparison of tropical Atlantic sea-surface temperatures to the temperatures of the global tropics is part of the statistical tools used by the forecast team, and those tools would favor a near-normal, rather than above-normal season. Analogs and regressions based on the temperature difference between the Atlantic MDR and Global Tropics, as well as the Niño 3.4 index point to outcomes closer to normal levels of activity.
These predictions are based on extensive monitoring, analysis, research activities, a suite of statistical prediction tools, and dynamical models. The dynamical model predictions come from the NOAA Climate Forecast System (CFS), NOAA Geophysical Fluid Dynamics Lab (GFDL) HiFLOR-S and SPEAR-MED models, the North American Multi-Model Ensemble (NMME), the United Kingdom Met Office (UKMET) GloSea6 model, and the European Centre for Medium-Range Weather Forecasting (ECMWF) Seas5 model. ENSO forecasts also use a combination of statistical and other dynamical models contained in the suite of Niño 3.4 SST forecasts, which is compiled by the IRI (International Research Institute for Climate and Society) and the NOAA Climate Prediction Center.
a. Long-term conditions and relations circulations
An inter-related set of atmospheric and oceanic conditions, which is conducive for hurricane development, is now present in the MDR and some features are likely to continue through the peak months of the hurricane season (August-September-October). The AMV is still reflecting a positive/warm state, and those positive/warm conditions are likely to continue through the season, setting a background for generally elevated activity. Of the set of conditions associated with the warm phase of the AMV, weaker vertical wind shear, weaker tropical easterly trade winds, a more conducive African Easterly Jet (AEJ), and a stronger West African Monsoon have been observed this year. Weaker shear is largely forecast to continue. This set of conditions allows for stronger African easterly waves, from which tropical storms and hurricanes can more easily develop (Bell and Chelliah, 2006). These storms then have an extended area with conducive conditions in which to intensify as they propagate westward over progressively warmer waters, and within an environment of reduced vertical wind shear, increased tropical moisture, and decreased atmospheric stability. The result is more, stronger, and longer-lived tropical storms and hurricanes, typical activity for an above-normal season.
Also in place is a more conducive AEJ. This wind pattern reflects weaker easterly winds (i.e., anomalous westerlies) along the equatorward flank of the AEJ axis. The position of the AEJ this year is not as far north as in 2021 at this same point in the calendar year, but it is still north of the long-term average position. The resulting increase in cyclonic relative vorticity is more conducive to the intensification of African Easterly Waves, especially when that same environment features reduced vertical wind shear, increased moisture, and decreased atmospheric stability.
The above atmospheric conditions are all consistent with an enhanced West African monsoon system, which is an integral component of the warm AMV phase. The West African monsoon has been enhanced this summer, as indicated by negative velocity potential anomalies and enhanced upper-level divergence throughout the region. In fact, the monsoon rains have been well above average for several months, indicating an early start to the monsoon season as well.
b. La Niña to continue
La Niña represents one phase of the climate phenomenon known as ENSO (El Niño-Southern Oscillation). The three phases of ENSO are El Niño, La Niña, and ENSO-Neutral. El Niño tends to suppress Atlantic hurricane activity, while La Niña tends to enhance it (Gray 1984; Goldenberg and Shapiro 1996). These impacts can be strongly modulated by conditions associated with a low- or high-activity era.
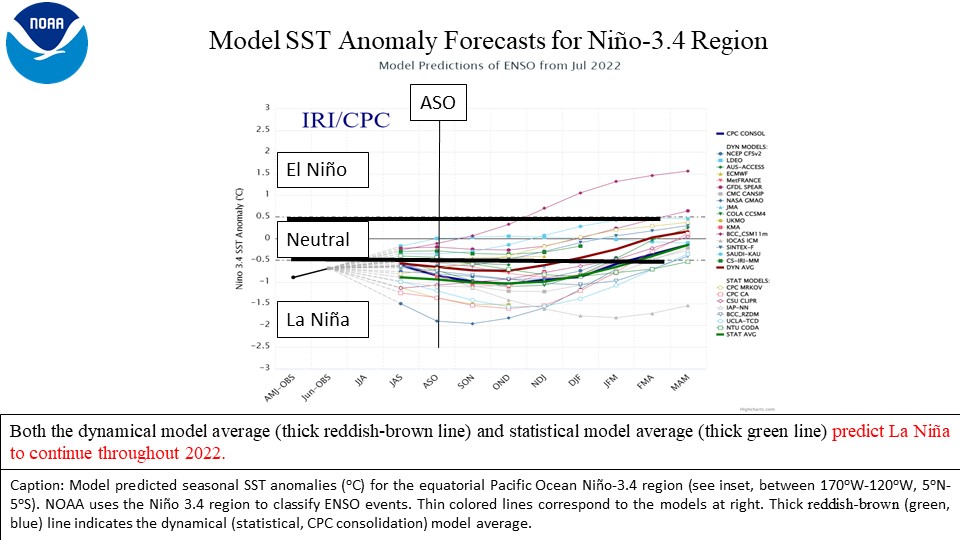
La Niña conditions are present at this time. As of July 18, 2022, the weekly SSTs are currently below average across the central and eastern equatorial Pacific, and the SST index for the Niño 3.4 region is -0.7°C;. The weekly Niño 3.4 index has been below -0.5°C since October 2021. The Niño 3.4 index has varied from -1.2°C to -0.5°C in the past few months, but has not shown any significant trends away from the La Niña range. The wind and outgoing longwave radiation (OLR) patterns over the central Pacific are also reflecting a continuation of atmospheric response to La Niña.
Looking forward, model-predicted SST anomalies in the Niño 3.4 region generally indicate La Niña (Niño 3.4 index less than -0.5°C) conditions throughout the hurricane season. A subset of the models indicate ENSO-neutral, while most of the models favor La Niña. The dynamical model average, statistical model average, and the CPC skill-based consolidation are all showing Niño 3.4 index values below the La Niña threshold.
The NMME model suite, some of which are included in the CPC/IRI plume, is showing La Niña conditions continuing through the peak months of the Atlantic Hurricane Season. The NMME based predictions for the SSTs in the Niño 3.4 region range from about -0.25°C to -1.4°C in September, with the most likely outcomes resulting in a moderate strength La Niña during August-September-October.
The official NOAA ENSO outlook from July of 2022 indicates a 62% chance of La Niña during the peak months (ASO) of the hurricane season, followed by a 36% chance of ENSO-neutral and only a 2% chance of El Niño.
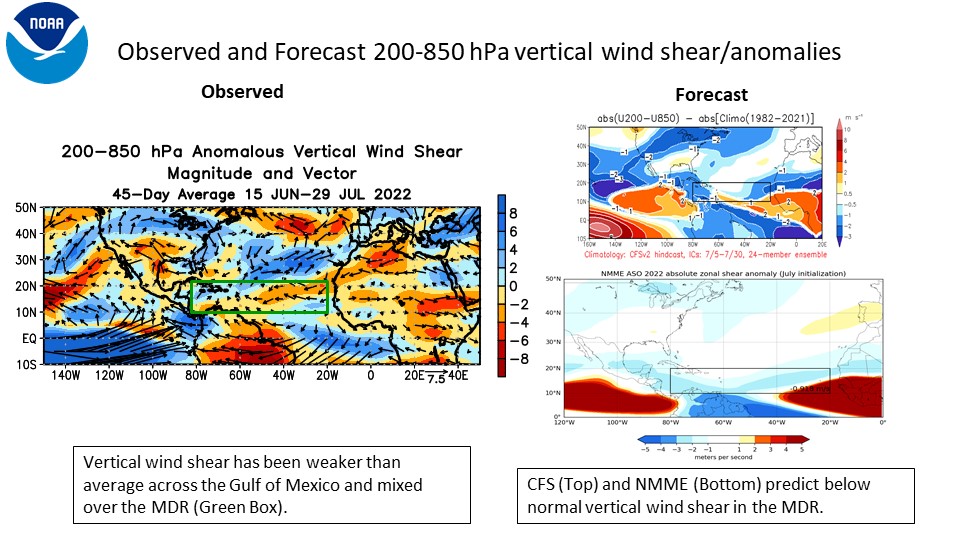
In addition to the similarities in the ENSO/Niño3.4 outlook, the CFS and NMME both predict slightly below-normal vertical wind shear over the Main Development Region. The CFS has a mixed pattern of predicted shear anomalies, but the MDR spatial average is below normal. The CFS shear predicted this year is similar to, but slightly weaker than, what was predicted last year, while the NMME shear outlook is the 13th lowest of the 30 years in the record. A moderate or strong La Niña would reinforce the high-activity era conditions, including reducing shear, further increasing the likelihood of an above-normal (or even extremely active) season. This would potentially result in a season with activity near the upper end of the forecast ranges. Therefore, the current hurricane season outlook reflects the expectation that the La Niña conditions will not compete with, and would likely reinforce the ongoing set of conditions associated with the current high-activity era for Atlantic hurricanes.
c. Factors increasing the uncertainty
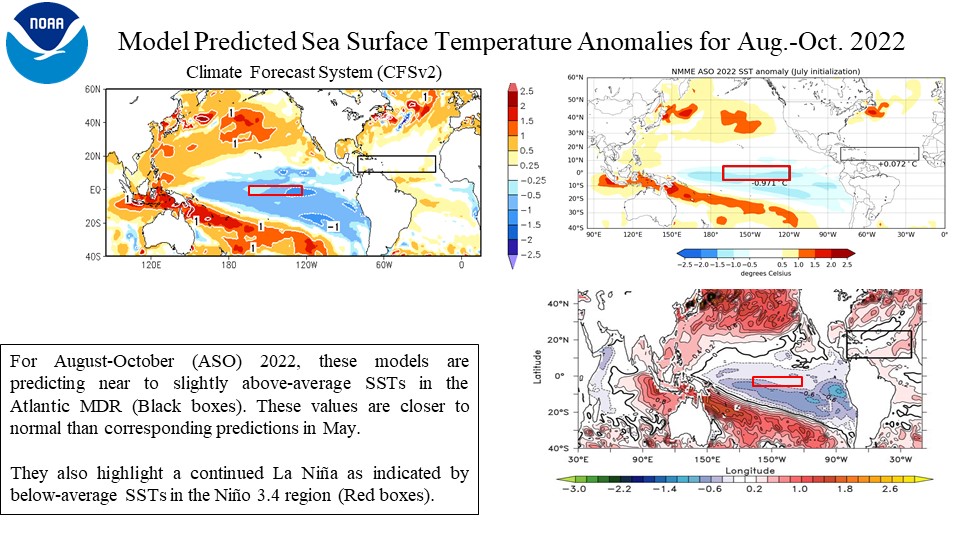
Sea-surface temperatures over the Atlantic have been quite variable during June and July, with alternating periods of above and below normal SSTs in parts of the MDR, resulting in near average temperatures. ERSST data shows that June monthly averaged SSTs in the MDR are close to average of the global tropics. Many of the recent model forecasts for SSTs in the MDR are for temperatures closer to normal than forecast model output from earlier in the year.
Additionally, sea-level pressures have been generally below normal in the Atlantic during the last 45 days. High resolution, developmental versions of the CFS contain predictions for sea-level pressures to transition to above average for most of the region. ECMWF Seas5 model data also reflects a large area of higher than average SLP for much of the extratropical Atlantic and near the Bahamas, with pressures predicted across the MDR close to average.
d. Current Seasonal Activity
The activity during June and July 2022 was close to normal. Three named storms have formed, which is close to average for this point in the season, but the to-date ACE is about 33 percent of normal. Normal is about 10 x 104 kt2, and this year the tropical cyclones have tallied about 3 x 10⁴ kt2. Early season (June-July) activity in general is not highly correlated with peak seasonal (August-November, ASON) activity.
NOAA FORECASTERS
Climate Prediction Center
- Matt Rosencrans, Physical Scientist; Matthew.Rosencrans{at}noaa.gov
- Dr. Hui Wang, Physical Scientist; Hui.Wang{at}noaa.gov
- Dr. Daniel Harnos, Meteorologist; Daniel.Harnos{at}noaa.gov
National Hurricane Center
- Eric Blake, Senior Hurricane Specialist; Eric.S.Blake{at}noaa.gov
- Dr. Chris Landsea, Branch Chief; Chris.Landsea{at}noaa.gov
- Dr. Richard Pasch, Senior Hurricane Specialist; Richard.J.Pasch{at}noaa.gov
Hurricane Research Division
- Stanley Goldenberg, Meteorologist; Stanley.Goldenberg{at}noaa.gov
REFERENCES
Bell, G. D., and M. Chelliah, 2006: Leading tropical modes associated with interannual and multi-decadal fluctuations in North Atlantic hurricane activity. J. Climate, 19, 590-612. Blake, E. S., P. Klotzbach, and G. D. Bell, 2018: Climate factors causing the extremely active 2017 Atlantic hurricane season. Presented at AMS 33rd Conference on Hurricanes and Tropical Meteorology, April 2018. Goldenberg, S. B., C. W. Landsea, A. M. Mestas-Nuñez, and W. M. Gray, 2001: The recent increase in Atlantic hurricane activity: Causes and implications. Science, 293, 474-479. Goldenberg, S. B. and L. J. Shapiro, 1996: Physical mechanisms for the association of El Niño and West African rainfall with Atlantic major hurricane activity. J. Climate, 9, 1169-1187. Gray, W. M., 1984: Atlantic seasonal hurricane frequency: Part I: El Niño and 30-mb quasi-bienniel oscillation influences. Mon. Wea. Rev., 112, 1649-1668. Klotzbach, P.J., and W. M. Gray, 2008: Multi-decadal Variability in North Atlantic Tropical Cyclone Activity. J. Climate, 21, 3929 - 3935.
|


