The 2019 Atlantic hurricane season outlook is an official product of the National Oceanic and Atmospheric Administration (NOAA) Climate Prediction Center (CPC). The outlook is produced in collaboration with hurricane experts from the National Hurricane Center (NHC) and the Hurricane Research Division (HRD). The Atlantic hurricane region includes the North Atlantic Ocean, Caribbean Sea, and Gulf of Mexico.
Interpretation of NOAA's Atlantic hurricane season outlook:
This outlook is a general guide to the expected overall activity during the upcoming hurricane season. It is not a seasonal hurricane landfall forecast, and it does not predict levels of activity for any particular location.
Preparedness:
Hurricane-related disasters can occur whether the season is active or relatively quiet. It only takes one hurricane (or tropical storm) to cause a disaster. It is crucial that residents, businesses, and government agencies of coastal and near-coastal regions prepare for every hurricane season regardless of this, or any other, seasonal outlook. The Federal Emergency Management Agency (FEMA), the National Hurricane Center (NHC), the Small Business Administration, and the American Red Cross all provide important hurricane preparedness information on their web sites.
NOAA does not make seasonal hurricane landfall predictions:
NOAA does not make seasonal hurricane landfall predictions. Hurricane landfalls are largely determined by the weather patterns in place as the hurricane approaches, which are only predictable when the storm is within several days of making landfall.
Nature of this Outlook and the "likely" ranges of activity:
This outlook is probabilistic, meaning the stated "likely" ranges of activity have a certain likelihood of occurring. The seasonal activity is expected to fall within these ranges in 7 out of 10 seasons with similar climate conditions and uncertainties to those expected this year. They do not represent the total possible ranges of activity seen in past similar years.
This outlook is based on 1) predictions of large-scale climate factors known to influence seasonal hurricane activity, and 2) climate models that directly predict seasonal hurricane activity.
Sources of uncertainty in the seasonal outlooks:
1. Predicting El Niño and La Niña (also called the El Niño-Southern Oscillation, or ENSO) and their impacts is an ongoing scientific challenge facing climate scientists today. Such forecasts made during the spring generally have limited skill.
2. Many combinations of named storms and hurricanes can occur for the same general set of climate conditions. For example, one cannot know with certainty whether a given climate signal will be associated with several short-lived storms or fewer longer-lived storms with greater intensity.
3. Model predictions of sea surface temperatures (SSTs), vertical wind shear, moisture, atmospheric stability, and other factors known to influence overall seasonal hurricane activity have limited skill this far in advance of the peak months (August-October) of the hurricane season.
4. Weather patterns that are unpredictable on seasonal time scales can sometimes develop and last for weeks or months, possibly affecting seasonal hurricane activity.
2019 Atlantic Hurricane Season Outlook: Summary
a. Predicted Activity
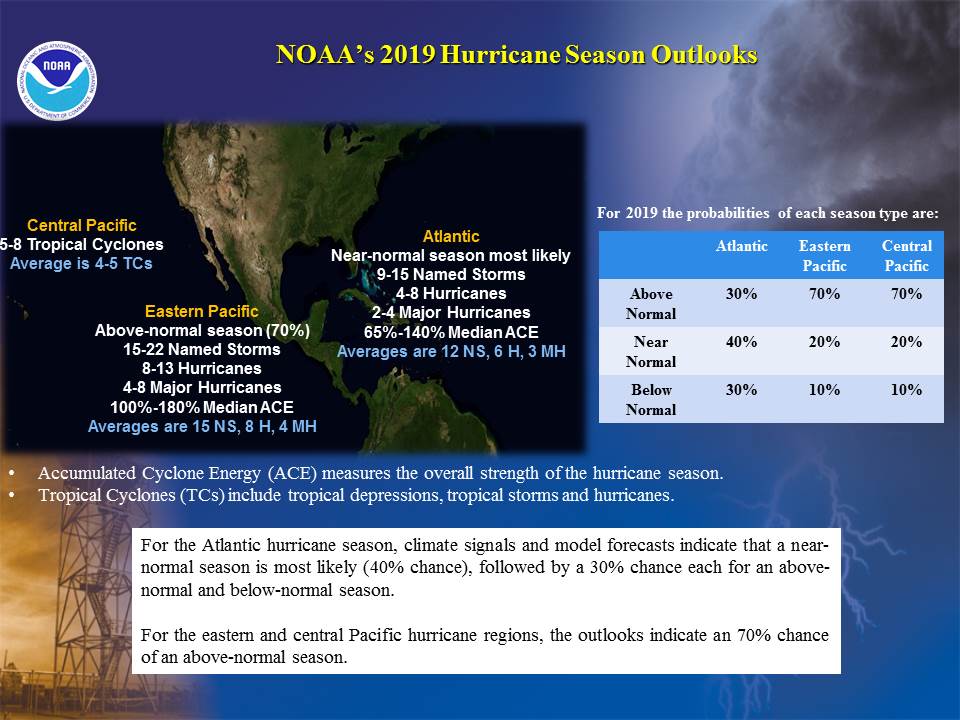
NOAA's outlook for the 2019 Atlantic Hurricane Season indicates that a near-normal season has the highest chance of occurring (40%), followed by equal chances (30%) of an above-normal season and a below-normal season. See NOAA definitions of above-, near-, and below-normal seasons. The Atlantic hurricane region includes the North Atlantic Ocean, Caribbean Sea, and Gulf of Mexico.
The 2019 outlook calls for a 70% probability for each of the following ranges of activity:
- 9-15 Named Storms
- 4-8 Hurricanes
- 2-4 Major Hurricanes
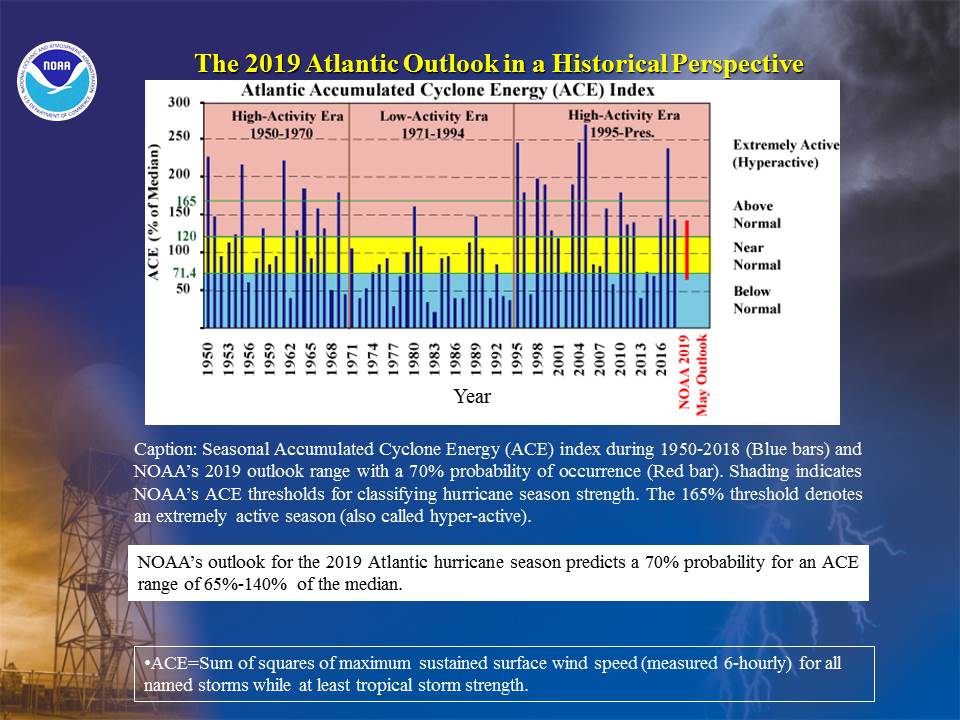
- Accumulated Cyclone Energy (ACE) range of 65%-140% of the median
The seasonal activity is expected to fall within these ranges in 70% of seasons with similar climate conditions and uncertainties to those expected this year. These ranges do not represent the total possible ranges of activity seen in past similar years. These expected ranges are centered on the 1981-2010 seasonal averages of 12 named storms, 6 hurricanes, and 3 major hurricanes. Most of the predicted activity is likely to occur during the peak months (August-October, ASO) of the hurricane season.
The Atlantic hurricane season officially runs from June 1st through November 30th. This outlook will be updated in early August to coincide with the onset of the peak months of the hurricane season.
b. Reasoning behind the outlook
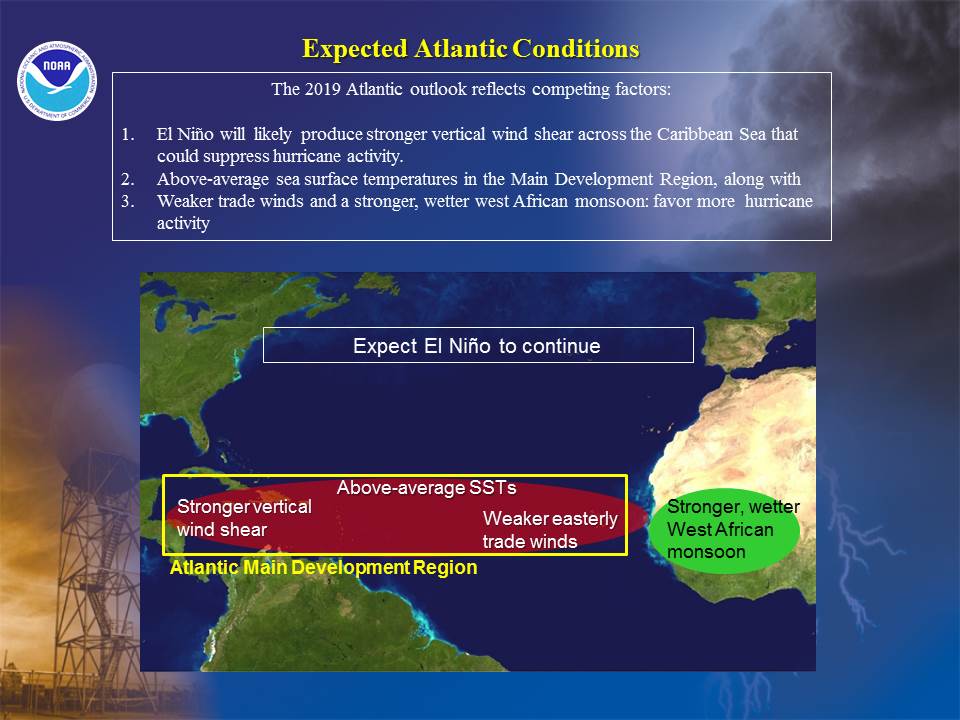
This outlook reflects the expectation of competing climate factors during August-October. El Niño is expected to persist and produce conditions that suppress the season, while expected conditions associated with the ongoing high-activity era for Atlantic hurricanes favor a more active season.
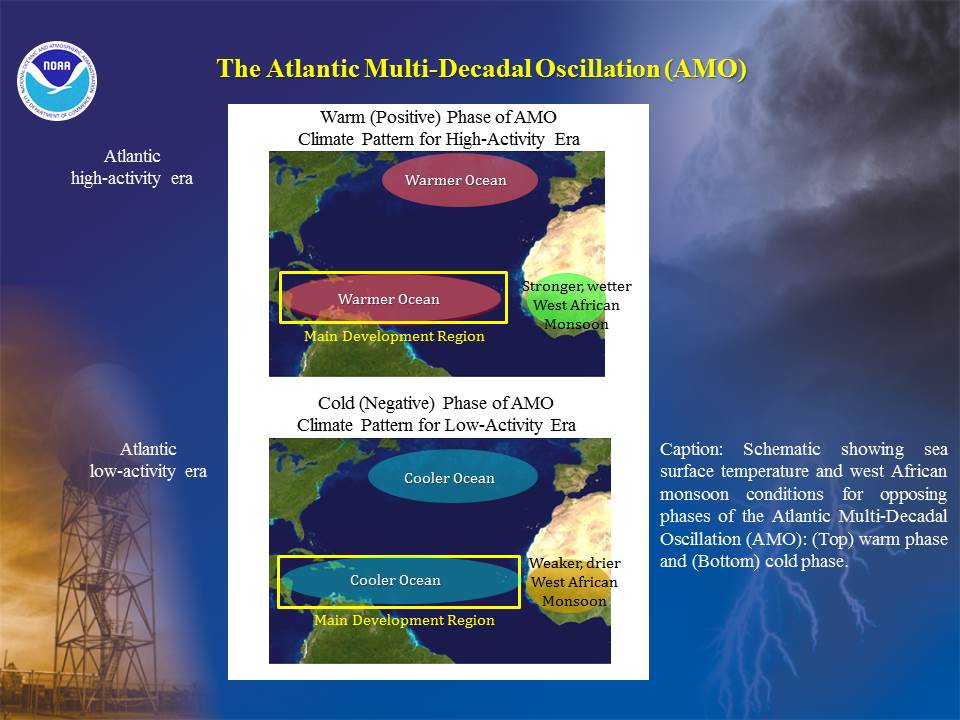
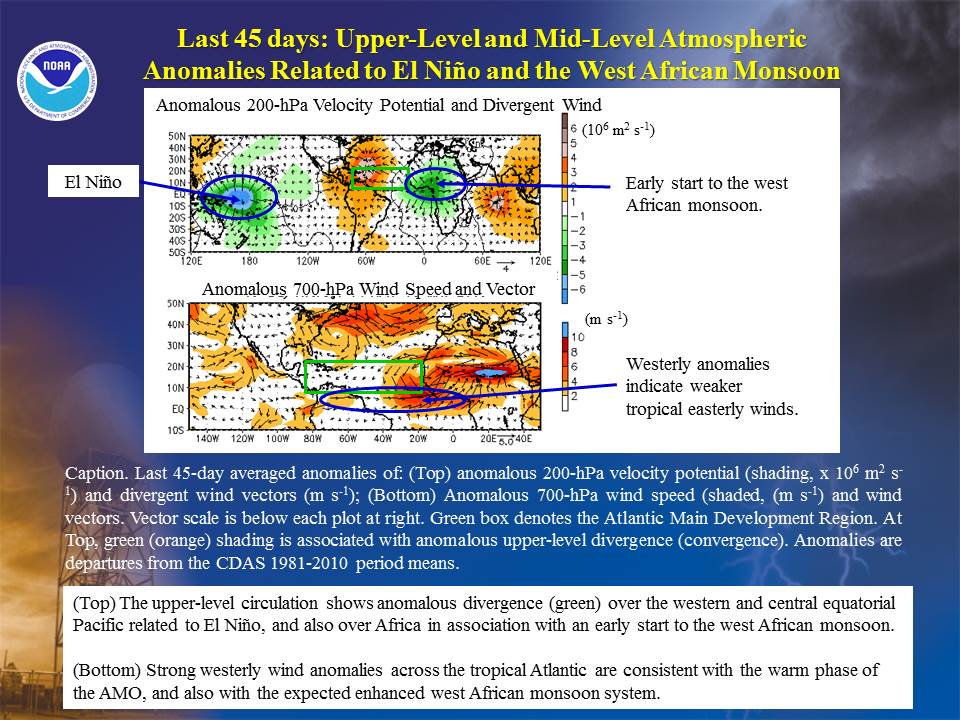
The high-activity era for Atlantic hurricanes began in 1995 in association with a transition to the warm phase of the Atlantic Multi-Decadal Oscillation (AMO). This climate pattern produces an inter-related set of atmospheric and oceanic conditions that are conducive to more active hurricane seasons. Key aspects of this pattern which are predicted for ASO 2019 include warmer sea surface temperatures (SSTs) and weaker trade winds in the eastern portion of the Atlantic hurricane Main Development Region (MDR), along with an enhanced West African monsoon. The MDR spans the tropical Atlantic Ocean and Caribbean Sea (Goldenberg and Shapiro 1996).
There is more uncertainty in the seasonal hurricane outlook this year because of competing climate factors, and because of varying model predictions of the magnitude and subsequent impact of each factor. For example, some models are predicting a weak El Niño during ASO while others are predicting a moderate-strength event. As a result, there are varying predicted impacts of El Niño on the Atlantic hurricane season. There are also considerable differences in model predictions for SSTs in the MDR, with some predictions being considerably warmer than others. Finally, it is difficult to predict the strength of the West African monsoon system and associated weaker trade winds this far in advance of the ASO period.
Preparedness for Tropical Storm and Hurricane Landfalls:
It only takes one storm hitting an area to cause a disaster, regardless of the overall activity for the season. Therefore, residents, businesses, and government agencies of coastal and near-coastal regions are urged to prepare every hurricane season regardless of this, or any other, seasonal outlook.
DISCUSSION
1. Expected 2019 activity
NOAA's outlook for the 2019 Atlantic Hurricane Season indicates that a near-normal season has the highest chance of occurring (40%), followed by equal chances (30%) of an above-normal season and a below-normal season. See NOAA definitions of above-, near-, and below-normal seasons.
An important measure of the total seasonal activity is NOAA's Accumulated Cyclone Energy (ACE) index, which accounts for the combined intensity and duration of all named storms and hurricanes during the season. This 2019 outlook indicates a 70% chance that the seasonal ACE range will be 65%-140% of the median. According to NOAA's hurricane season classifications, an ACE value between 71.4% and 120% of the 1981-2010 median reflects a near-normal season. Values above (below) this range reflect an above-normal (below-normal) season.
The 2019 Atlantic hurricane season is predicted to produce (with 70% probability for each range) 9-15 named storms, of which 4-8 are expected to become hurricanes, and 2-4 of those are expected to become major hurricanes. These ranges are centered on the 1981-2010 period averages of about 12 named storms, 6 hurricanes and 3 major hurricanes.
Predicting the location, number, timing, and strength of hurricane landfalls are ultimately related to the daily weather patterns, storm genesis locations and steering patterns. These patterns are not predictable weeks or months in advance. As a result, it is not possible to reliably predict the number or intensity of landfalling hurricanes in a seasonal outlook, or whether a given locality will be impacted by a hurricane this season.
2. Science behind the 2019 Outlook
NOAA's Atlantic hurricane season outlooks are based on predictions of the main climate factors and their associated conditions known to influence seasonal Atlantic hurricane activity. These predictions are based on extensive monitoring, analysis, research activities, a suite of statistical prediction tools, and dynamical models. The dynamical model predictions come from the NOAA Climate Forecast System (CFS), NOAA Geophysical Fluid Dynamics Lab (GFDL) FLOR model, the North American Multi-Model Ensemble (NMME), the United Kingdom Met Office (UKMET) GloSea5 model, and the European Centre for Medium Range Weather Forecasting (ECMWF) model. El Niño forecasts are also provided from statistical and other dynamical models contained in the suite of Niño 3.4 SST forecasts, which is compiled by the International Research Institute for Climate and Society (IRI) and the NOAA Climate Prediction Center (CPC).
NOAA's 2019 Atlantic hurricane season outlook reflects three competing factors:
1) The likely continuation of El Niño during the peak months (ASO) of the hurricane season. El Niño typically suppresses Atlantic hurricane activity by causing increased vertical wind shear, anomalous sinking motion, and increased atmospheric stability across the western MDR (i.e., mainly the Caribbean Sea) (Gray 1984).
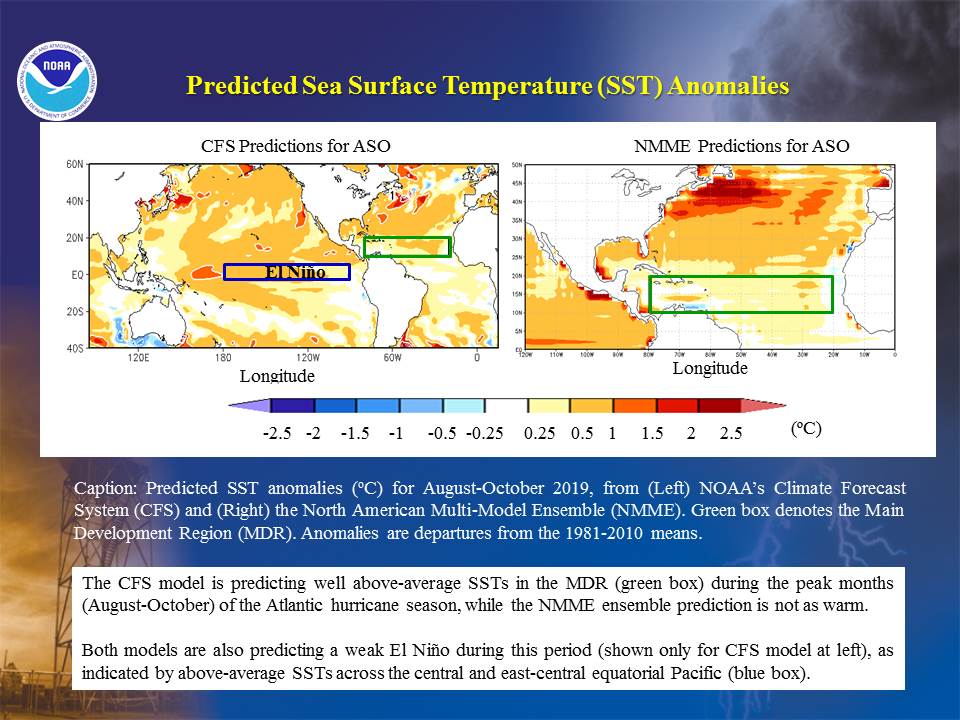
2) Competing with the possible suppressing influence of El Niño this year is the expectation of above-average SSTs in the MDR. Nearly all climate models predict SSTs to be above average in this region during ASO, with most predicting departures of +0.2°C to + 0.4°C. These predictions are consistent with the warm phase of the AMO, which has persisted during the ASO season since 1995 and has favored more active hurricane seasons.
3) Also competing with El Niño this season is the expectation for weaker trade winds in the eastern portion of the MDR, along with an enhanced West African monsoon. These conditions favor more active hurricane seasons, and are also typical of the warm AMO phase.
a. Weak or moderate-strength El Niño
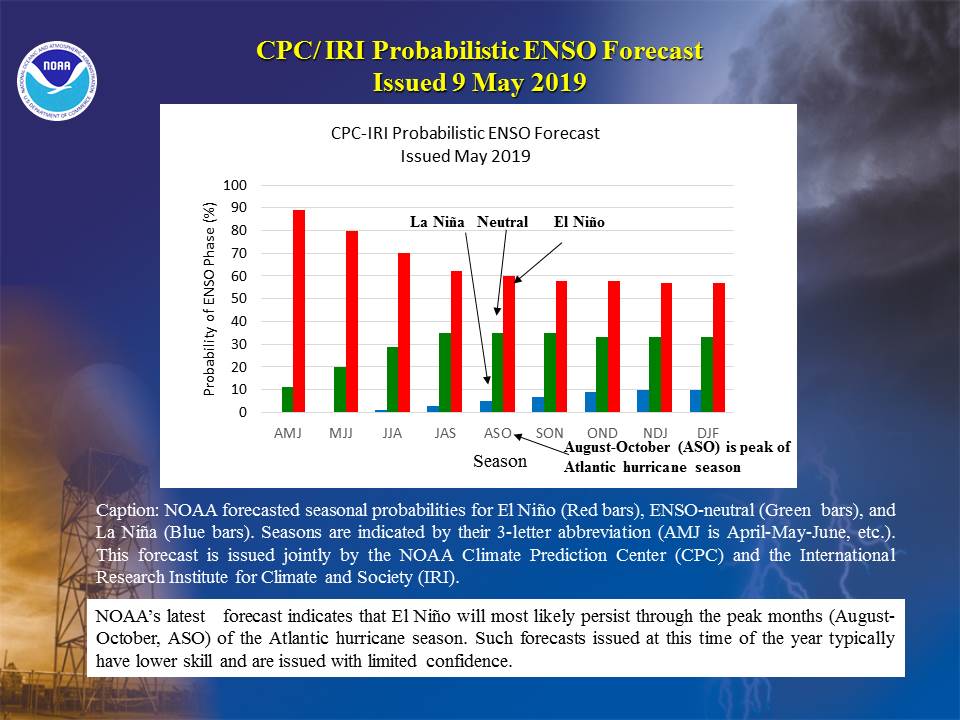
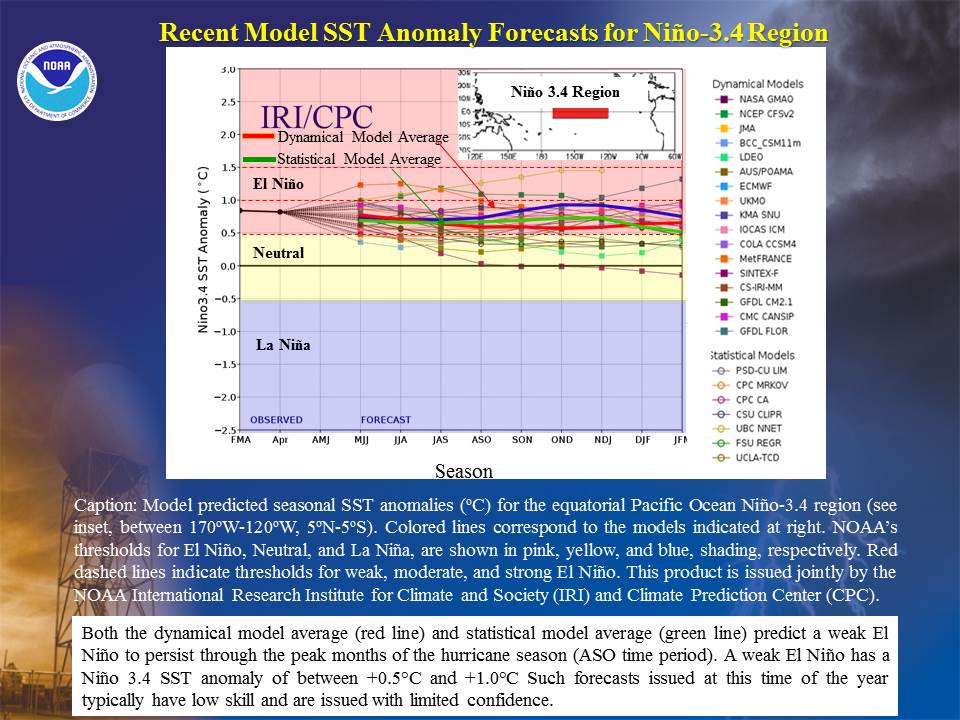
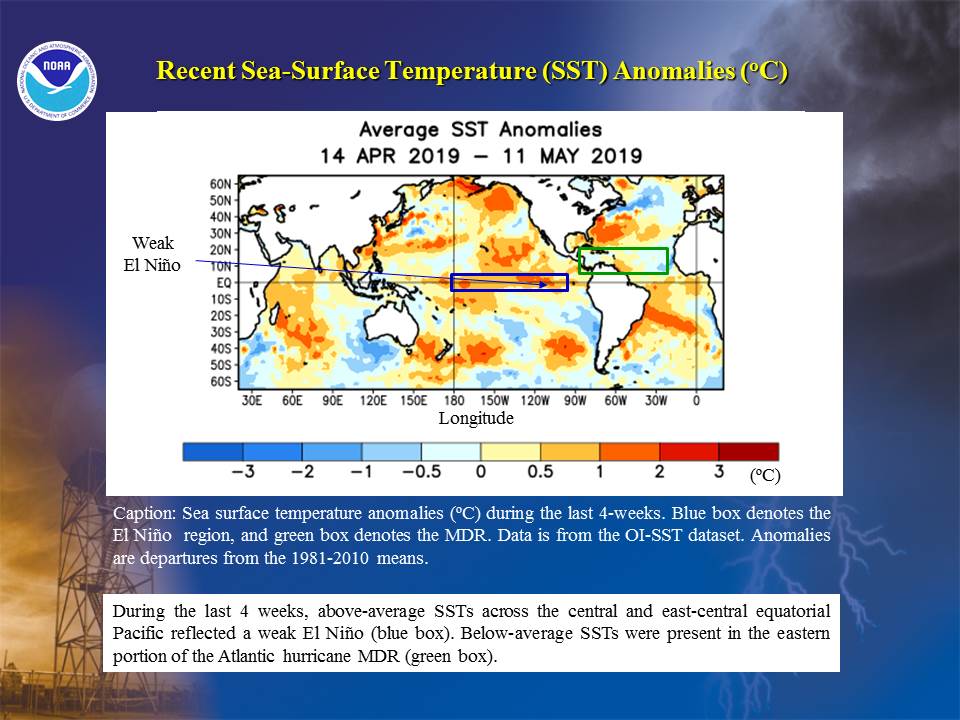
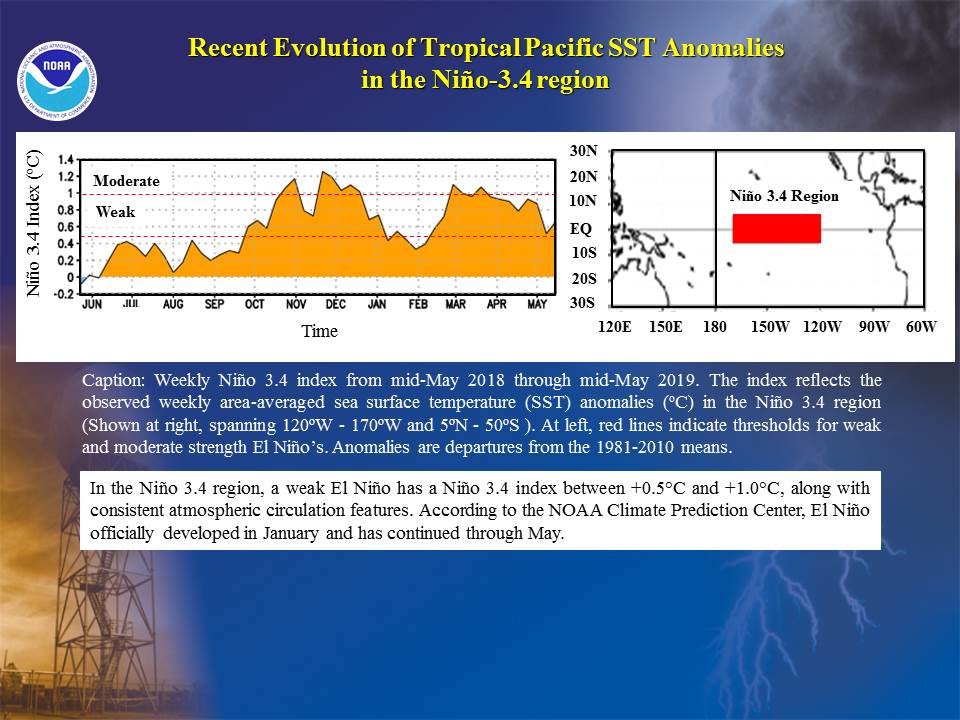
El Niño developed late in 2018 and is still present. SSTs are currently 0.5°C to 1.5°C above average across the central and east-central equatorial Pacific, and the latest weekly SST index for the Niño 3.4 region is near +0.5°C. The Niño 3.4 region spans the east-central equatorial Pacific between 120°W-170°W and 5°N-5°S. El Niño is classified as a Niño 3.4 index at or above +0.5°C for five consecutive overlapping 3-month seasons, along with consistent atmospheric impacts. A weak El Niño is defined by a sustained Niño 3.4 index between +0.5°C and +1.0°C, and a moderate-strength El Niño is defined by a sustained Niño 3.4 index between +1.0°C and +1.5°C.
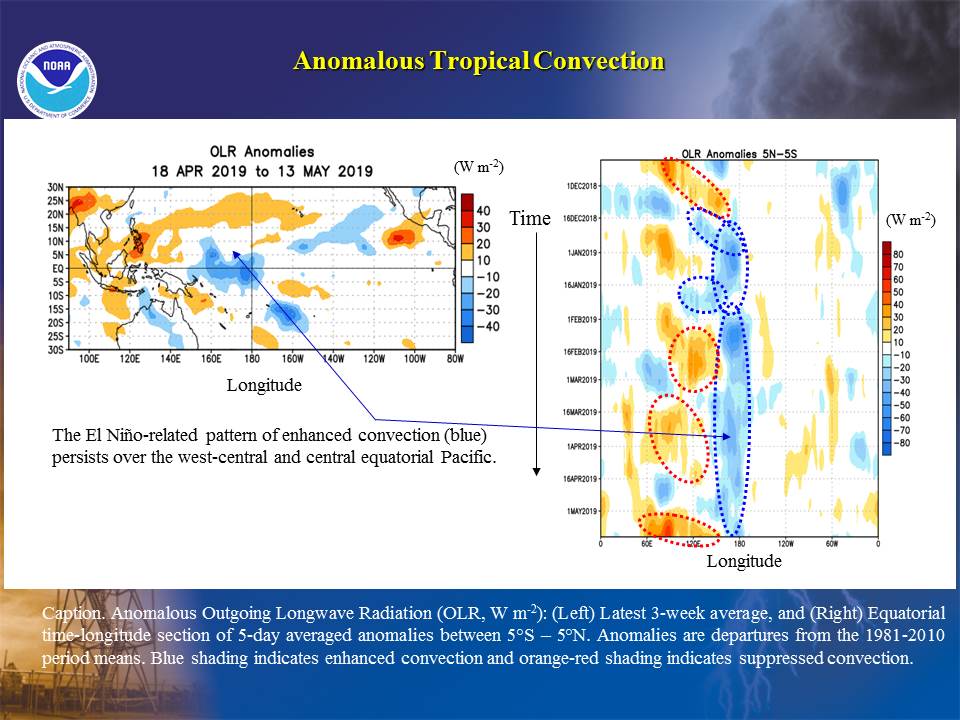
The current atmospheric anomalies reflect a weak El Niño. Its main convective forcing onto the atmosphere is currently confined to the western and central equatorial Pacific, as measured by Outgoing Longwave Radiation (OLR). In the tropics, low OLR values indicate high and cold cloud tops associated with deep convection, while high OLR values indicate little or no convection. The current El Niño is associated with negative OLR anomalies (enhanced convection) across the west-central and central equatorial Pacific and with positive OLR anomalies (suppressed convection) over Indonesia. A time-longitude section shows that this pattern has been very persistent since last winter. By comparison, a stronger (i.e., moderate) El Niño would typically have a farther eastward extension of enhanced convection than is currently observed.
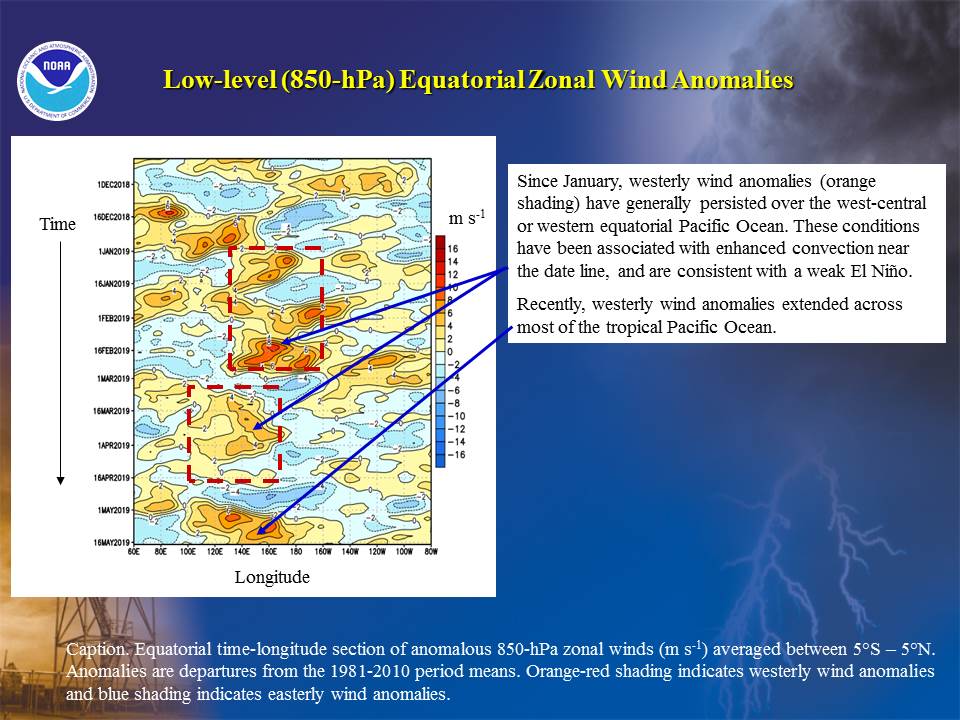
The low-level (850-hPa) atmospheric zonal wind anomalies are also typical of a weak El Niño. In recent months, the low level easterly winds have been weaker than average (indicated by westerly anomalies, orange-red shading) mainly over the west-central or western equatorial Pacific Ocean. These conditions have been associated with the enhanced convection near the date line. A stronger El Niño would typically feature a much farther eastward extension of the westerly anomalies.
Based on current conditions, the recent oceanic evolution, and the spread in model forecasts, NOAA's latest ENSO outlook indicates about a 60% chance of El Niño during Aug.-Oct.
Model predicted SST anomalies in the Niño 3.4 region for ASO 2019 generally reflect a weak or moderate-strength El Niño. Both the dynamical model average (red line) and statistical model average (green line) indicate a weak El Niño through the peak months of the hurricane season (ASO time period).
A weaker El Niño typically has less of a suppressing influence on the Atlantic hurricane season than a moderate-strength event. Given the uncertainty in such predictions made at this time of the year, the predicted ranges in this outlook reflect the possibility of either a weak- or moderate-strength event.
b. Predicted conditions in the MDR
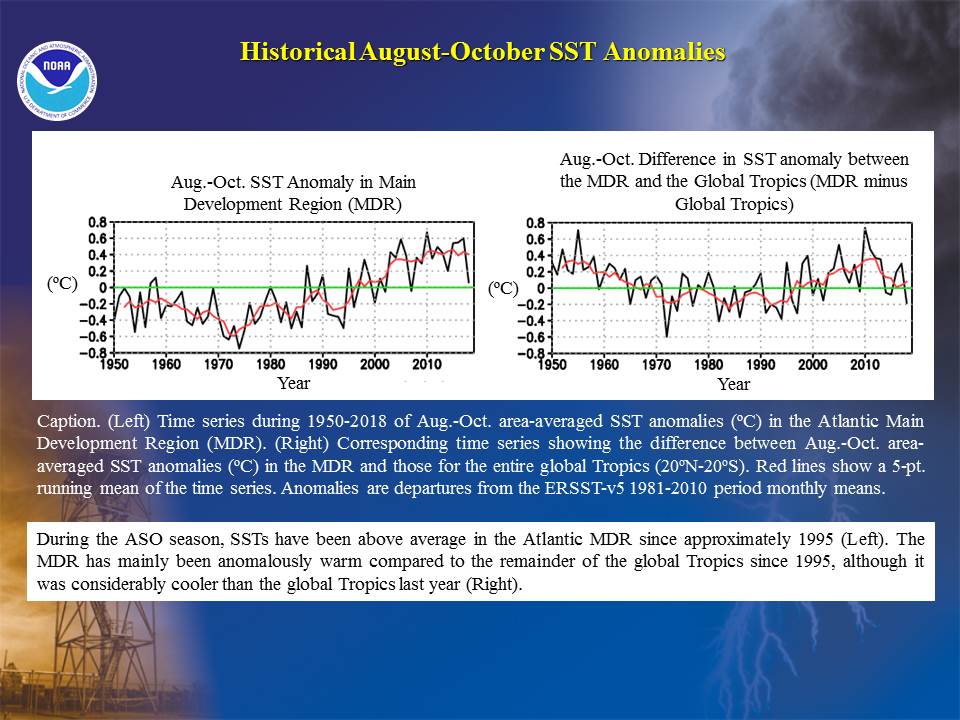
SSTs are currently near average in the central MDR, and below average near Africa. For the MDR as a whole, climate models predict above-average SSTs during ASO, with most predicting departures of +0.2°C to +0.4°C. However, there is considerable spread in model predictions of Atlantic SSTs this far ahead of the ASO season. During the last few hurricane seasons, SSTs in the MDR have been warmer than some models have predicted (Blake et al., 2018). This cool bias limits our confidence in the model SST forecasts for this fall.
Nonetheless, current model predictions are consistent with the ongoing warm phase of the AMO, as indicated by warmer SST anomalies in the MDR compared to the remainder of the global Tropics. The warm AMO phase is the main climate driver behind the current Atlantic high-activity era that began in 1995 (Goldenberg et al. 2001, Bell and Chelliah 2006, Klotzbach and Gray 2008). Similar conditions also contributed to the high-activity era that ended in 1970, while opposite anomaly patterns contributed to the intervening low-activity era of 1971-1994.
Consistent with the warm AMO, two inter-related atmospheric features are now present, and are expected to persist. These factors include 1) anomalous westerly winds at 700-hPa across the central and eastern tropical Atlantic, and 2) an enhanced West African monsoon system. These conditions are expected to contribute to the warming of the MDR as the hurricane season progresses. They also directly contribute to increased hurricane activity in the eastern MDR. In contrast, in the western MDR increased vertical wind shear and anomalous sinking motion associated with the ongoing El Niño are expected to suppress hurricane activity.
The predicted result of these competing factors is near-normal activity during ASO within the MDR. The activity within the MDR during ASO is the main contributor to the overall activity of the hurricane season. The combination of a weaker El Niño, much warmer SSTs in the MDR, and a stronger West African monsoon favors hurricane activity near the upper ends of our predicted ranges. Conversely, the combination of a moderate El Niño, only a slightly warmer MDR, and a weaker impact from the West African monsoon favors activity in the lower portion of the predicted ranges.
NOAA FORECASTERS:
Climate Prediction Center
National Hurricane Center
Hurricane Research Division
| 

