|
2018 Atlantic Hurricane Season Outlook: Summary
a. Predicted Activity
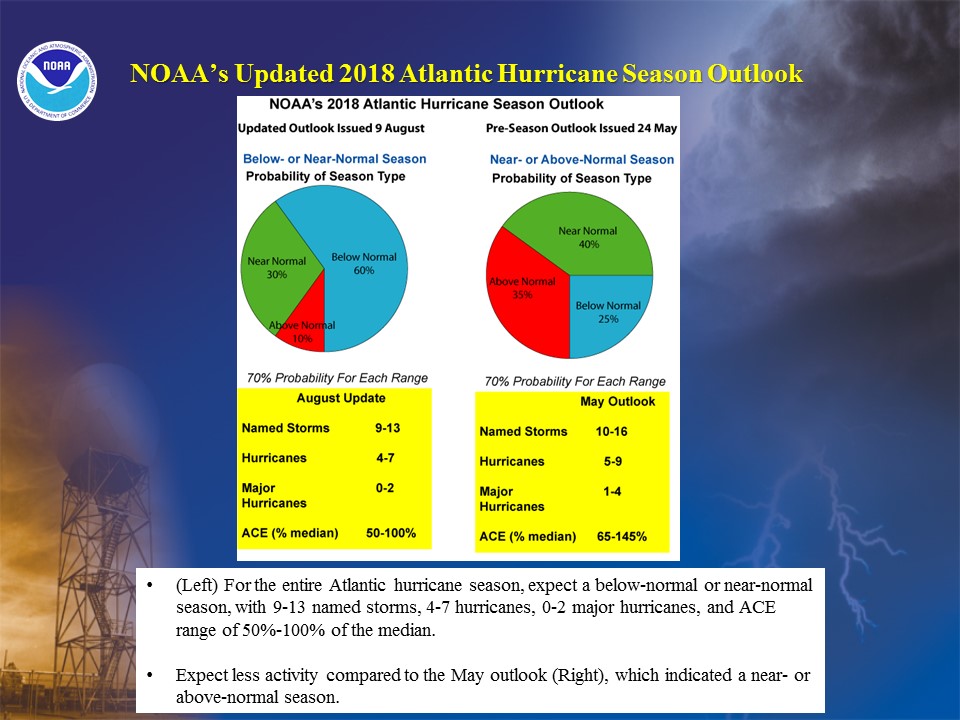
NOAA's updated 2018 Atlantic Hurricane Season Outlook indicates that a below-normal or near-normal hurricane season is expected. The outlook indicates a 60% chance of a below-normal season, a 30% chance of a near-normal season, and only a 10% chance of an above-normal season. Less activity is now expected compared to NOAA's pre-season outlook issued on 24 May. See NOAA definitions of above-, near-, and below-normal seasons. The Atlantic hurricane region includes the North Atlantic Ocean, Caribbean Sea, and Gulf of Mexico.
This updated outlook calls for a 70% probability for each of the following ranges of activity during the 2018 hurricane season, which runs from June 1st through November 30th:
- 9-13 Named Storms, which includes the three named storms to date
- 4-7 Hurricanes, which includes the two hurricanes to date
- 0-2 Major Hurricanes
- Accumulated Cyclone Energy (ACE) range of 50%-100% of the median, which includes 16% ACE from the three named storms to date
The seasonal activity is expected to fall within these ranges in 70% of seasons with similar conditions and uncertainties to those expected this year. These ranges do not represent the total possible ranges of activity seen in past similar years.
The predicted ranges are centered below the 1981-2010 season averages of about 12 named storms, 6 hurricanes, and 3 major hurricanes.
To date, the 2018 Atlantic hurricane season has produced four named storms, of which two became hurricanes. For the remainder of the season, we expect an additional 5-9 named storms, with 2-5 becoming hurricanes and 0-2 of those becoming major hurricanes.
Changes from the pre-season outlook issued on May 24th:
We now expect a less active season than was predicted in May. A below-normal or near-normal season is now predicted, whereas in May the prediction was for a near- or above-normal season. The chance of a below-normal season has now increased to 60% (up from 25% in May), and the chance of an above-normal season has decreased to 10% (down from 35% in May). The chance of a near-normal season has decreased to 30% (down from 40% in May).
The predicted numbers of named storms, major hurricanes, and seasonal ACE have also decreased from the May outlook (which indicated likely seasonal ranges of 10-16 named storms, 5-9 hurricanes, 1-4 major hurricanes, and an ACE range of 65%-145% of the median).
Reasons why the season is now expected to be less active:
There are four main reasons why we now expect the season to be less active:
1. Exceptionally cool sea surface temperature (SST) anomalies have persisted this summer in the Atlantic hurricane Main Development Region (MDR, which includes the tropical Atlantic and Caribbean Sea- Goldenberg and Shapiro 1996). These conditions are now much more likely to persist through the peak months (August-October, ASO) of the hurricane season than some key models had predicted previously.
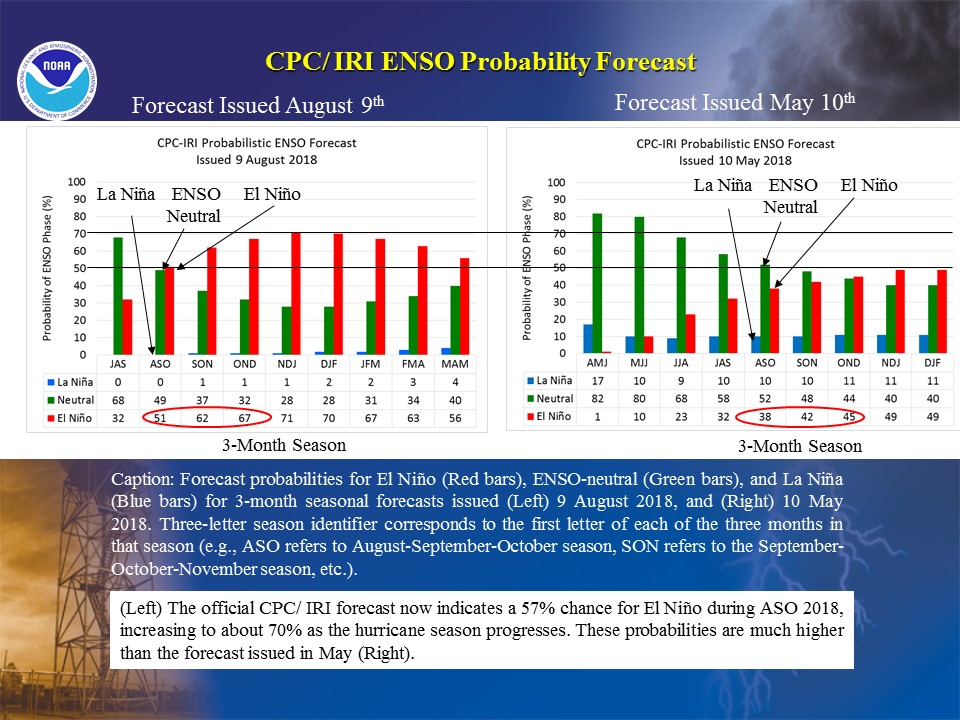
2. There is an increased likelihood of El Niño developing and suppressing the hurricane activity. The chance for El Niño during the hurricane season has increased to near 70% (Left), compared to the 45% indicated in the May outlook (Right). Models are predicting El Niño to become strong enough to help suppress the hurricane season.
3. Several components of the atmospheric circulation patterns are not conducive to hurricane activity within the MDR. These less conducive conditions are expected to persist over the next several months. They include stronger vertical wind shear and trade winds, along with generally cooler and drier air, increased atmospheric stability, and anomalous sinking motion.
4. Consistent with items 1-3, all models now predict a less active season than they did in May.
Preparedness for Tropical Storm and Hurricane Landfalls:
Hurricanes can, and have, struck the U.S. in near- and below-normal seasons. Catastrophic Major Hurricane Andrew in 1992 is one such example, which occurred during an otherwise below-normal season that had only one major hurricane (Andrew). It only takes one storm hitting an area to cause a disaster. Therefore, residents, businesses, and government agencies of coastal and near-coastal regions are urged to prepare every hurricane season regardless of the overall activity predicted by this, or any other, seasonal outlook.
DISCUSSION
1. Expected 2018 activity
NOAA's updated 2018 Atlantic Hurricane Season Outlook indicates that a below-normal or near-normal hurricane season is expected. The outlook indicates a 60% chance of a below-normal season, a 30% chance of a near-normal season, and only a 10% chance of an above-normal season. We now expect the season to be less active than was predicted in May. See NOAA definitions of above-, near-, and below-normal seasons.
The total seasonal activity is measured by NOAA's Accumulated Cyclone Energy (ACE) index, which accounts for the combined intensity and duration of all named storms and hurricanes during the season. This outlook indicates a 70% chance that the 2018 seasonal ACE range will be 50%-100% of the median. According to NOAA's hurricane season classifications, an ACE value between 71.4% and 120% of the 1981-2010 median reflects a near-normal season. Values below 71.4% reflect a below-normal season, and values above 120% reflect an above-normal season.
The current predicted ACE range indicates a less active season than was predicted in May (65%-145% of the median ACE). The current range extends farther down into the below-normal season category, and it no longer extends into the above-normal category.
The 2018 Atlantic hurricane season is now predicted to produce (with 70% probability for each range) 9-13 named storms, of which 4-7 are expected to become hurricanes, and 0-2 of those are expected to become major hurricanes. These ranges are centered below the 1981-2010 seasonal averages of about 12 named storms, 6 hurricanes and 3 major hurricanes.
To date, the 2018 Atlantic hurricane season has produced four named storms, of which two became hurricanes. For the remainder of the season, we expect an additional 5-9 named storms, with 2-5 becoming hurricanes and 0-2 of those becoming major hurricanes. [The August-November seasonal averages are about 10 named storms, 6 hurricanes and 3 major hurricanes.]
Predicting the location, number, timing, and strength of hurricane landfalls are all ultimately related to the daily weather patterns, storm genesis locations and steering patterns. These patterns are not predictable weeks or months in advance. As a result, it is currently not possible to reliably predict the number or intensity of landfalling hurricanes in a seasonal outlook, or whether a given locality will be impacted by a hurricane this season. Therefore, NOAA does not make a seasonal hurricane landfall outlook.
2. Science behind the 2018 Outlook
Four main factors now point to less activity than was predicted in May. These include: (1) continued below-average SSTs in the MDR, along with continued cooler SST anomalies in the MDR compared to the remainder of the global Tropics, (2) a higher likelihood of El Niño developing and becoming strong enough to suppress hurricane activity, (3) a continuation of the generally-non-conducive atmospheric conditions now present within the MDR, and (4) model predictions for a less active season.
These expectations are based on extensive monitoring, analysis, and research activities, a suite of statistical prediction tools, and dynamical model forecasts. The dynamical model predictions are provided by:
- NOAA Climate Forecast System (CFS),
- NOAA Geophysical Fluid Dynamics Lab (GFDL) FLOR and Hi-FLOR models,
- North American Multi-Model Ensemble (NMME),
- United Kingdom Met Office (UKMET) GloSea5 model, and
- European Centre for Medium Range Weather Forecasting (ECMWF) model.
ENSO forecasts are also provided from a suite of statistical and other dynamical models contained in the suite of Niño 3.4 SST forecasts, which is compiled by NOAA's IRI (International Research Institute for Climate and Society) and the CPC. [ENSO refers to El Niño/ Southern Oscillation, which has three phases: El Niño, neutral, and La Niña.].
a. Cool sea surface temperature (SST) anomalies in the MDR
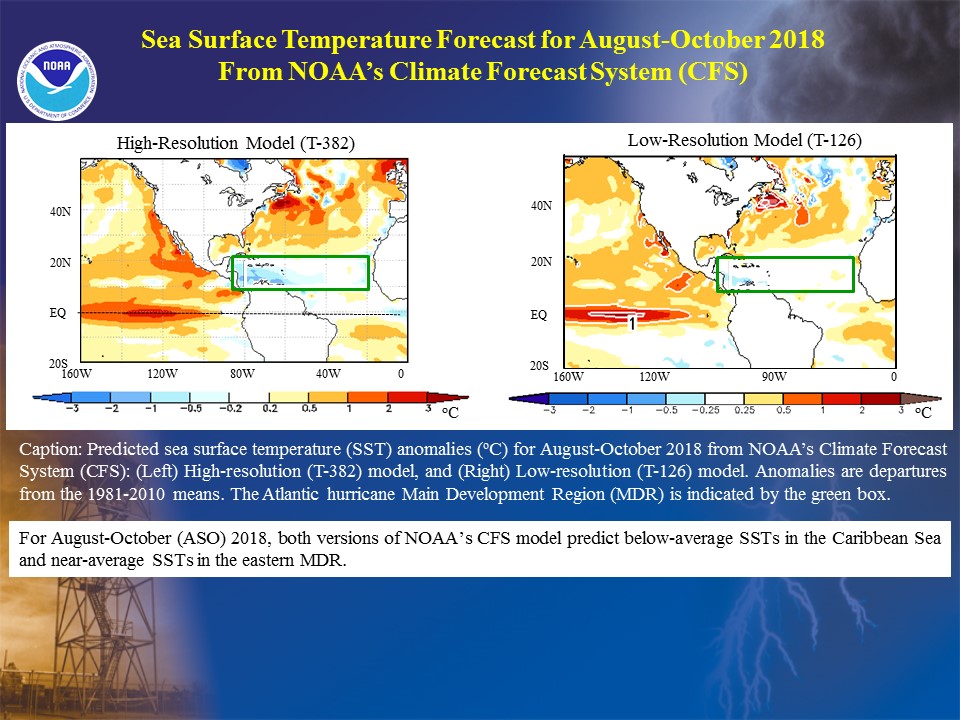
SSTs in the MDR have been well below average (top) this summer, which is in marked contrast to the exceptionally warm SSTs observed last year during the extremely active 2017 hurricane season (Blake et al., 2018; Bell et al., 2018). The CFS model predicts below-average SSTs in the western MDR during ASO 2018 and near-average SSTs in the eastern MDR.
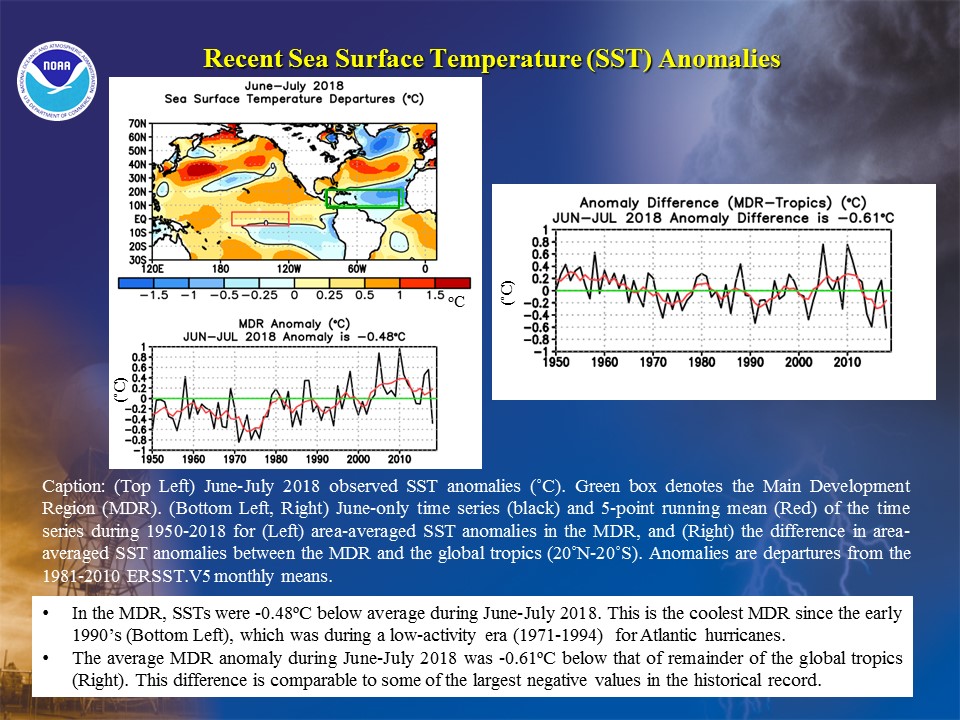
The current extent of the anomalous cooling in the MDR is summarized using several time series. During June-July 2018, area-averaged SSTs were -0.48°C below average (middle). The most anomalous cooling was observed in the far eastern MDR, where temperatures were 1.0°C to 2°C below average. This is the coldest June-July period for the MDR since the early 1990s, which was during a low-activity era for Atlantic hurricanes.
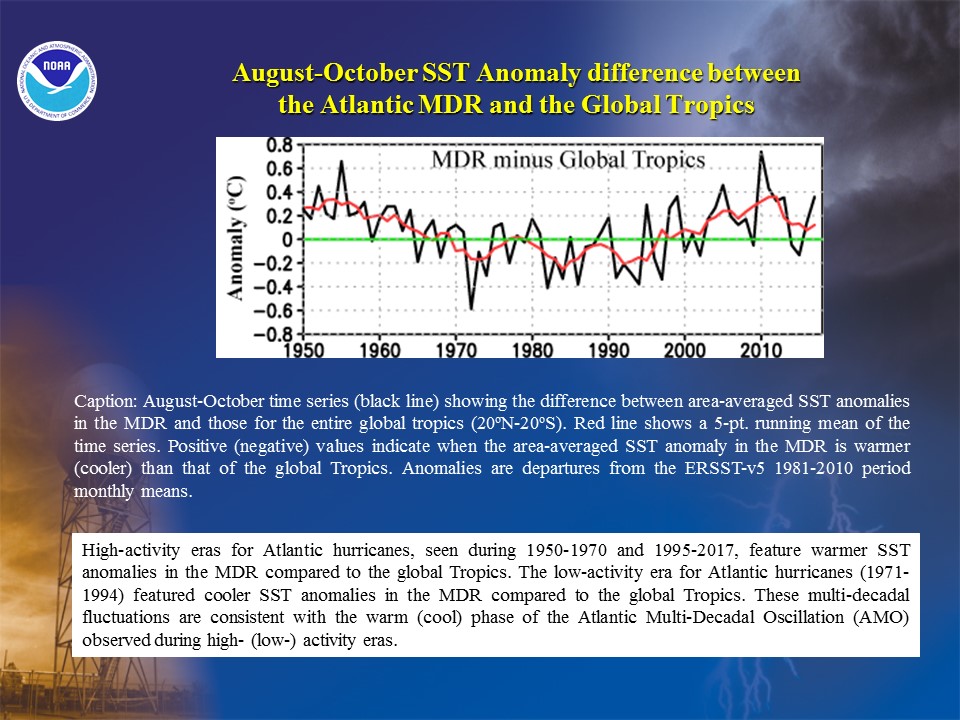
Two additional features of the current SST anomaly pattern suggest a less active Atlantic hurricane season. Firstly, the area-averaged SST anomaly in the MDR during June-July 2018 was -0.61°C colder than the area-average for the remainder of the global Tropics (Right). This difference is among the coldest in the historical record. The CFS model predicts the MDR to stay relatively cool compared to the remainder of the global Tropics during ASO 2018, which is in marked contrast to the comparatively warm MDR observed during most of the high-activity era for Atlantic hurricanes which began in 1995 (Goldenberg et al. 2001; Bell and Chelliah 2006).
Secondly, the area east of the Caribbean Islands is currently cooler than average (-0.73°C) while the eastern tropical South Atlantic Ocean is warmer than average (0.49 °C). This north-south dipole pattern reflects the strongest negative phase of the Atlantic Meridional Mode (AMM, Chiang and Vimont, 2004) in the 1950-2018 record. The AMM is a leading source of coupled ocean-atmosphere variability over the Atlantic, meaning that the atmospheric and oceanic anomalies can reinforce each other and persist on time scales of seasons rather than days or weeks.
Therefore, the current negative AMM pattern provides additional observational support for expecting the MDR to remain cooler than average during the peak months of the hurricane season. This negative phase of the AMM is also associated with stronger low-level northerly and northeasterly trade winds, which are currently observed over the northern portion of the MDR. These winds produce cooler, drier, and more stable air masses which help to suppress hurricane activity.
These overall conditions are a main reason why the hurricane season is expected to be less active than was predicted in May.
b. Increased chance of El Niño
The CPC classifies the three phases of ENSO (El Niño, neutral, and La Niña) based on the Niño 3.4 index. This index is defined as the area-averaged SST anomaly in the east-central equatorial Pacific between 170°W- 120°W and 5°N-5°S, which is called the Niño 3.4 region. Recently, equatorial SSTs were slightly above average in the central and east-central Pacific, and the Niño 3.4 index ranged between 0.1°C and 0.4°C. These values reflect ENSO-neutral (no El Niño or La Niña), which is classified as a Niño 3.4 index between -0.5°C and 0.5°C.
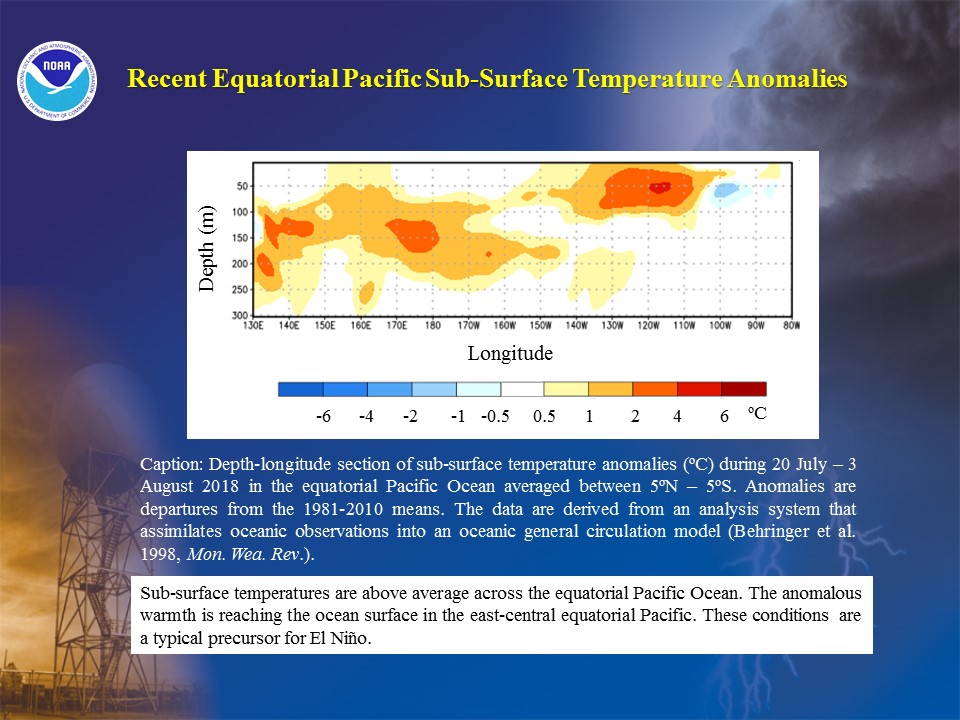
Within the eastern half of the equatorial Pacific Ocean, sub-surface temperatures are now anomalously warm. Temperatures are generally 1-4°C above average in the vicinity of the oceanic thermocline, and this anomalous warmth is beginning to reach the ocean surface. This warmth reflects an anomalously deep oceanic thermocline and a deeper-than-average pool of warm water, both of which are typical precursors to El Niño.
The CPC classifies El Niño as having a Niño 3.4 index at or above ).5°C for 5-consecutive overlapping 3-month seasons. The most recent CPC/IRI ENSO probability forecast indicates a 51% chance of El Niño during ASO 2018 (Left), increasing to about 70% as the hurricane season progresses. In May, the chance for El Niño was only 38% during ASO, increasing to 45% later in the hurricane season (Right). The sharply increased chance of El Niño is another reason why this updated 2018 hurricane outlook reflects less activity than was predicted in May.
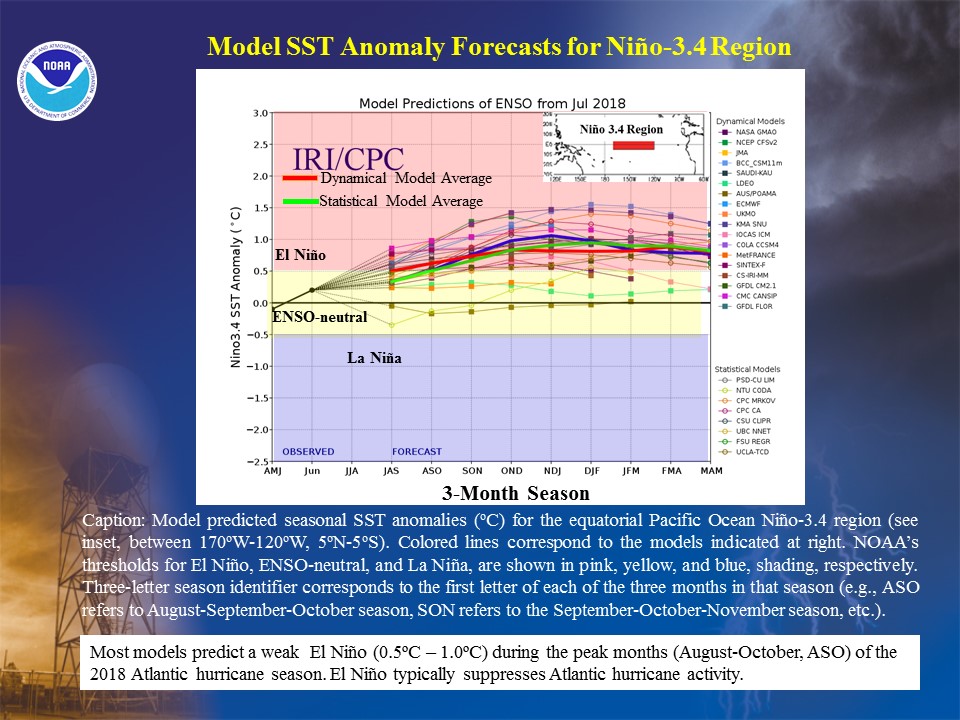
The averages of the most recent dynamical model predictions (thick red line) and statistical model predictions (thick green line) indicate that El Niño will form during the ASO season, and approach moderate strength (Niño 3.4 index of 1.0°C-1.5°C) as the season progresses. In May, the average of the dynamical model predictions indicated ENSO-neutral throughout the hurricane season.
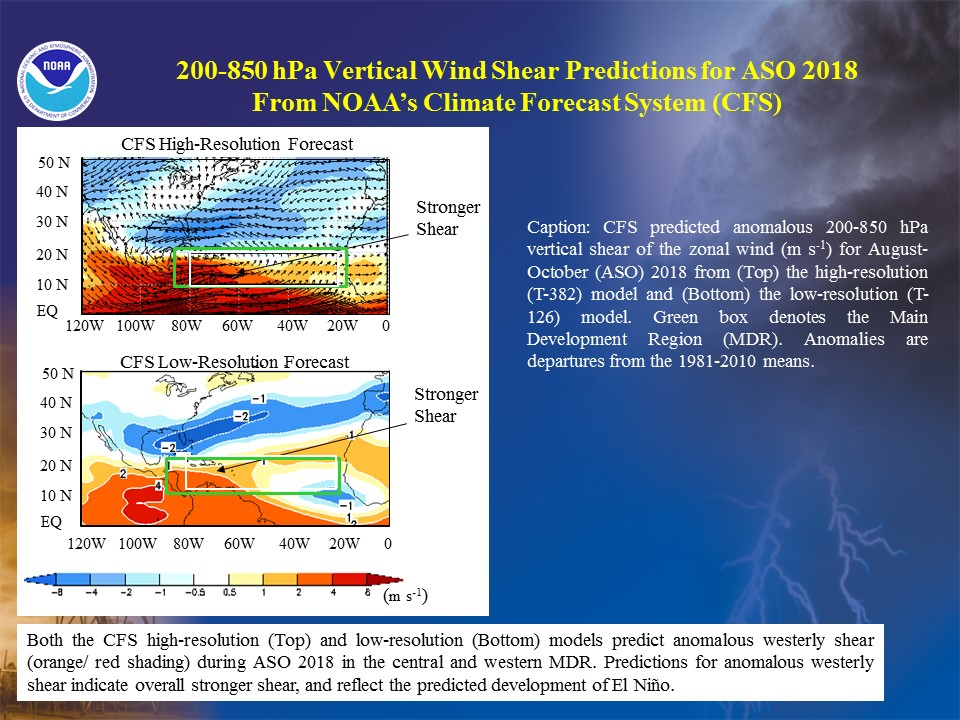
Both the hi- and low-resolution versions of NOAA's CFS model also predict El Niño to develop during ASO 2018. These models predict El Niño to produce enhanced westerly vertical wind shear (Gray 1984; Bell and Chelliah 2006), thus helping to maintain the strong shear now present across the western and central MDR and therefore suppressing the overall Atlantic hurricane activity. These predictions for significant El Niño impacts contrast to those issued in May, when both versions of the CFS predicted ENSO-neutral along with anomalous easterly (i.e. weaker) vertical wind shear in the MDR.
c. Non-conducive atmospheric conditions in the MDR
Another main reason why the hurricane season outlook is now calling for less activity is that the current and predicted atmospheric conditions within the MDR are not conducive to an above-normal season. These conditions include: 1) stronger vertical wind shear, 2) stronger northeasterly and northerly trade winds, and 3) generally cooler and drier air, increased atmospheric stability, and the combination of anomalous upper-level convergence and sinking motion.
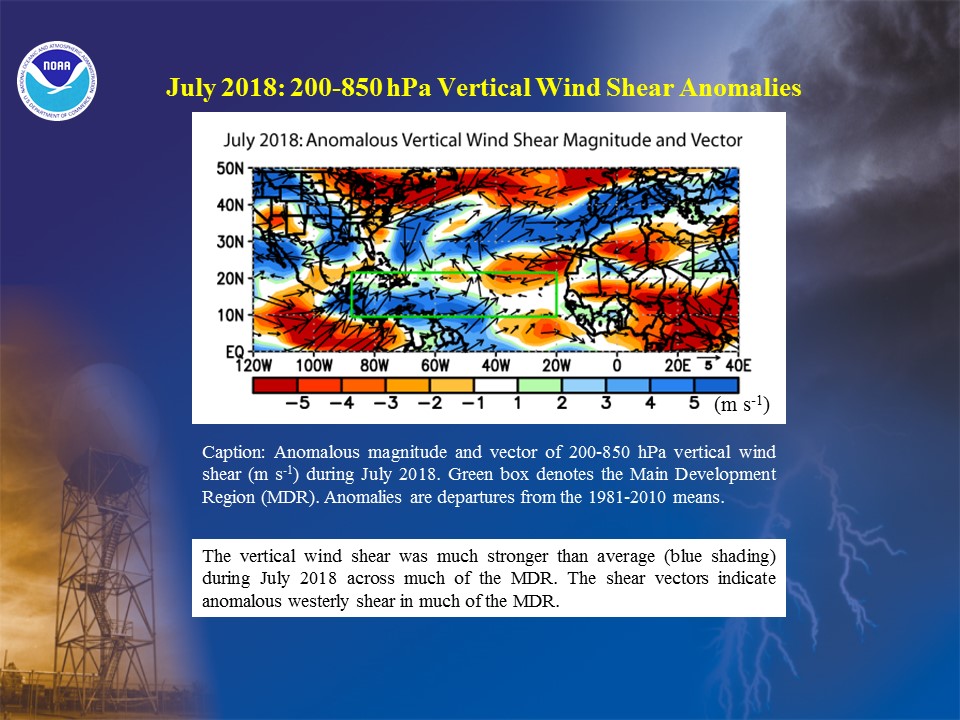
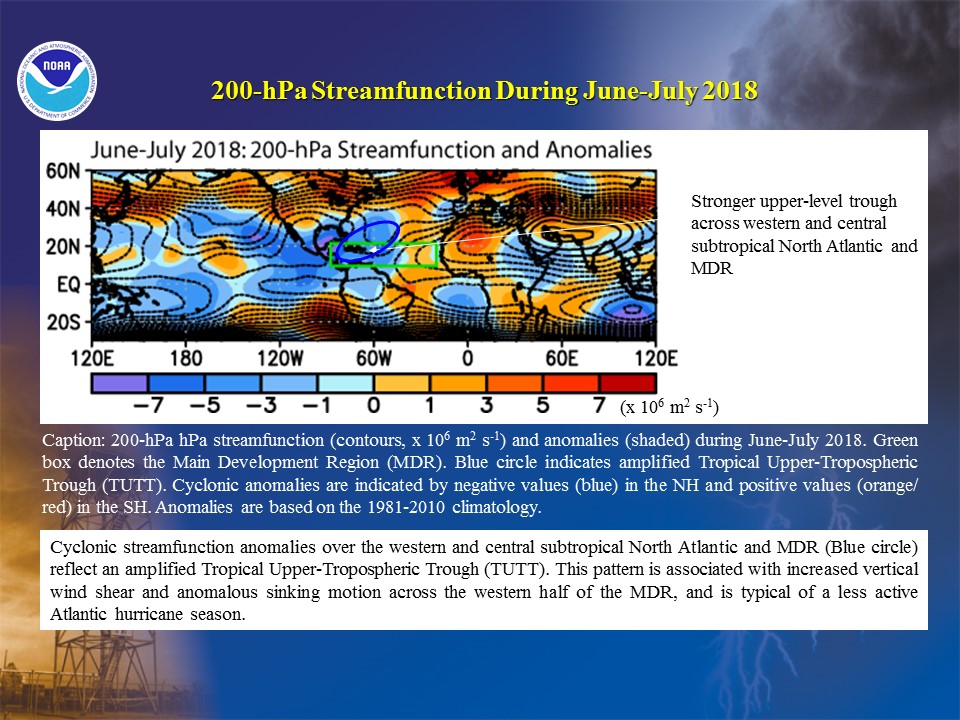
The vertical wind shear has been stronger than average across the western and central MDR. This increased shear is linked to anomalously strong upper-level westerly winds in association with an enhanced Tropical Upper-Tropospheric Trough (TUTT). The enhanced TUTT is also contributing to anomalous upper-level convergence and sinking motion, along with increased atmospheric stability, across the western half of the MDR. This combination of conditions has historically suppressed hurricane activity. Both the CFS high-resolution (T-382) and low-resolution (T-126) models predict these conditions to persist during ASO 2018, along with stronger shear, due mainly to the predicted development of El Niño.
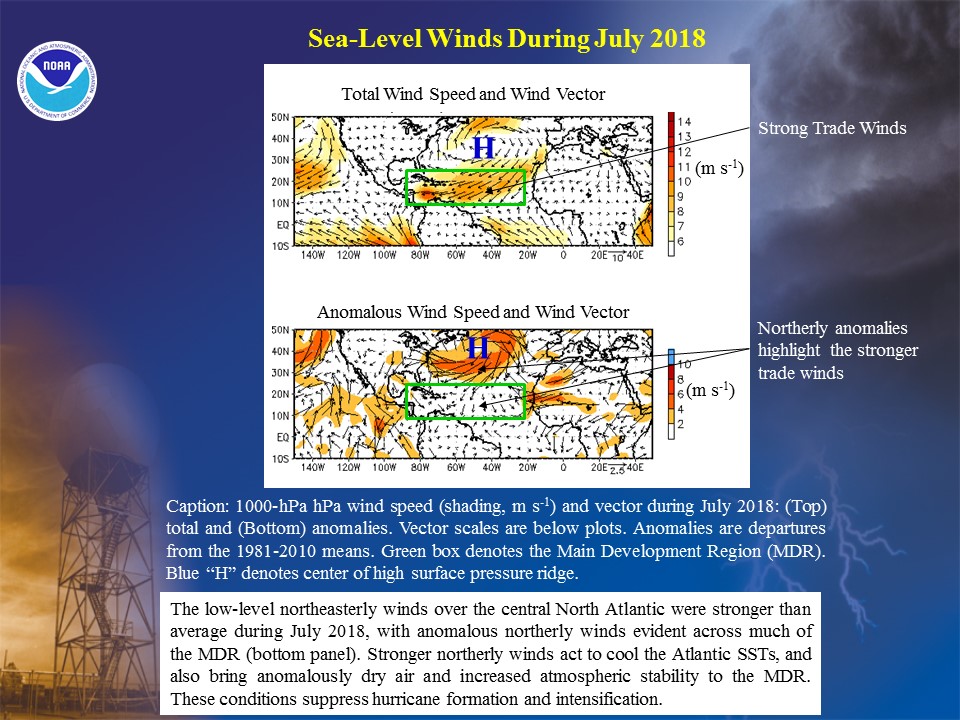
Stronger northeasterly and northerly trade winds have been present this summer within the MDR. This wind pattern contributes to cooler, drier, and more stable air masses, and also acts to cool the Atlantic SSTs. These conditions have been partly linked to a persistent and strong surface pressure ridge over the central North Atlantic. They have also been associated with the strong negative phase of the AMM. This tropical link increases forecaster confidence that these conditions will persist during ASO 2018.
Overall, multiple factors now point to a below-normal season. These include a persistence of cooler SST anomalies in the MDR (now linked with the AMM) and the likely development of El Niño. Both of these factors are expected to help maintain the current set of atmospheric conditions which has historically suppressed overall hurricane activity.
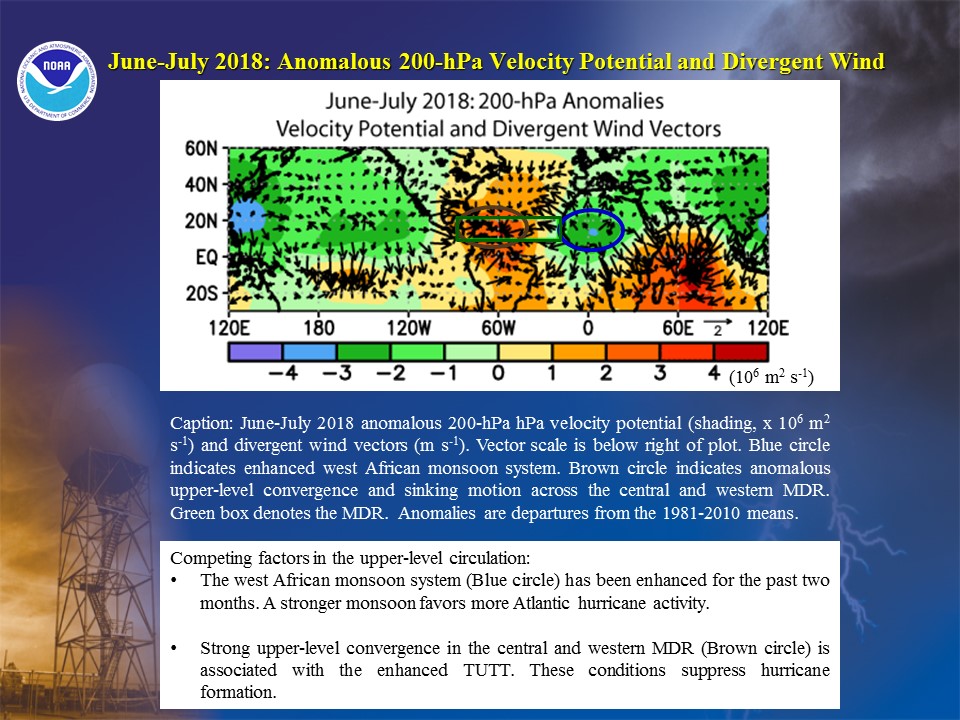
In contrast to the above conditions, the west African monsoon system has been enhanced this summer. A stronger west African monsoon typically favors more hurricane activity. This competing influence is a main reason why the overall hurricane activity could be in the near-normal range, despite the many factors which could suppress the season.
|


