Skip Navigation Links www.nws.noaa.gov 
NOAA logo - Click to go to the NOAA home page National Weather Service   NWS logo - Click to go to the NWS home page
Climate Prediction Center

 
HOME > Expert Assessments > Climate Diagnostics Bulletin  
 

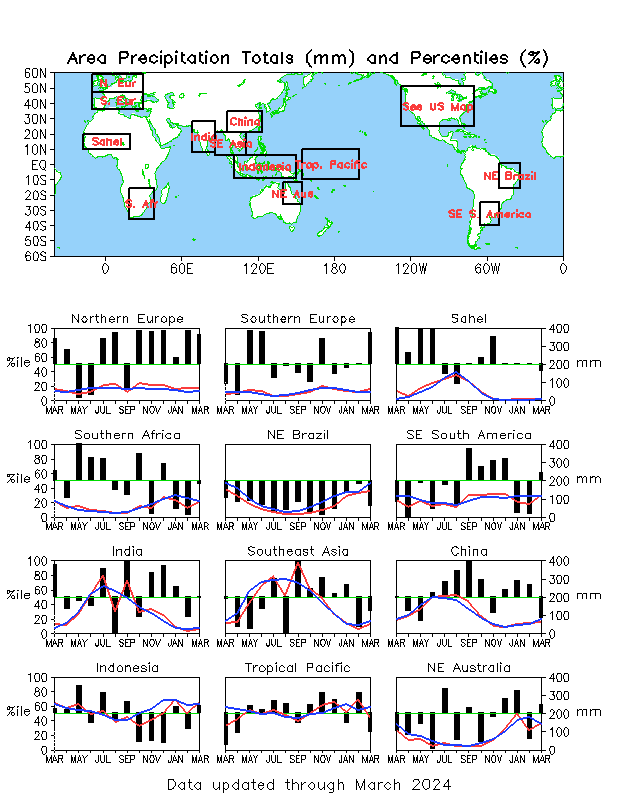
figure e4

FIGURE E4. Areal estimates of monthly mean precipitation amounts (mm, solid lines) and precipitation percentiles (%, bars) for the most recent 13 months obtained from a merge of raingauge observations and satellite-derived precipitation estimates (Janowiak and Xie 1999, J. Climate, 12, 3335–3342). The monthly precipitation climatology (mm, dashed lines) is from the 1981-2010 base period monthly means. Monthly percentiles are not shown if the monthly mean is less than 5 mm.


NOAA/ National Weather Service
NOAA Center for Weather and Climate Prediction
Climate Prediction Center
5830 University Research Court
College Park, Maryland 20740
Page Author: Climate Prediction Center Internet Team
Page last modified: August 16, 2007
Disclaimer
Information Quality
Credits
Glossary
Privacy Policy
Freedom of Information Act (FOIA)
About Us
Career Opportunities