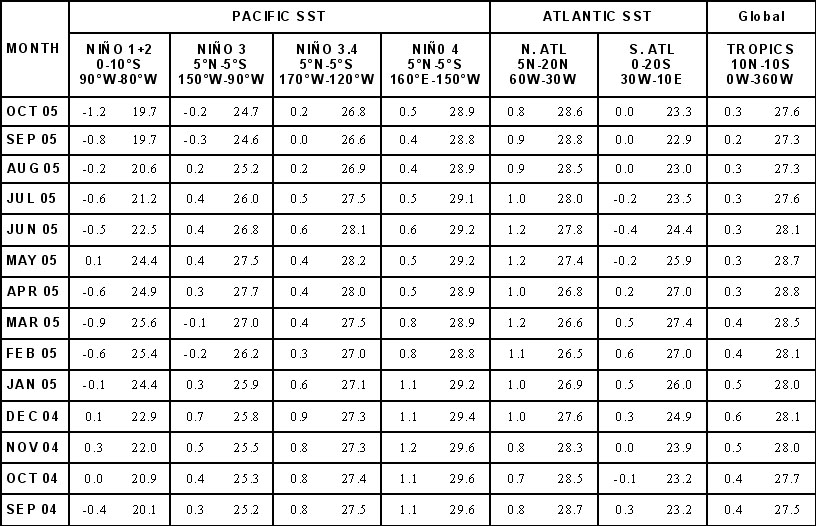
TABLE T2 Mean and anomalous sea surface temperature (°C) for the most recent 12 months. Anomalies are departures from the 1971–2000 adjusted OI climatology (Smith and Reynolds 1998, J. Climate, 11, 3320-3323). NOAA/ National Weather Service National Centers for Environmental Prediction Climate Prediction Center 5200 Auth Road Camp Springs, Maryland 20746 Climate Prediction Center Web Team Disclaimer Privacy Notice