Tropical Highlights - July 2004
Equatorial sea surface temperature
(SST) anomalies increased across the central and east-central Pacific during
July 2004, and remained below average in the eastern Pacific (Fig.
T18, Table T2). Despite the increase in SST
anomalies, the atmospheric indices continue to be dominated by
month-to-month variability associated with intraseasonal (Madden-Julian
Oscillation - MJO) activity (Figs. T11, T12,
T13, Table T1).
The pattern of Tropical SSTs during July featured positive anomalies greater
than +1.0°C across the central Pacific between 175°E and 140°W and below
average SSTs east of 125°W (Fig. T18). The
SST anomaly in the Niño 3.4 region increased to 0.6, the highest value
since October 2003, and the Niño 4 anomaly increased to 0.8, the highest
value since December 2003 (Table T2). In
contrast, the anomaly in the Niño 1+2 region remained less than -1.0 for
the third consecutive month (Table T2).
The oceanic thermocline, measured by the depth of the 20°
C isotherm deepened in the central Pacific and remained shallower than
average in the eastern Pacific (Figs. T15, T16),
resulting in an increased slope of the oceanic thermocline relative to June.
Consistent with these conditions, oceanic temperature anomalies at
thermocline depth increased to 2-3° C above
average in the western and central equatorial Pacific and remained 2-3°
C below average in the eastern Pacific (Fig. T17).
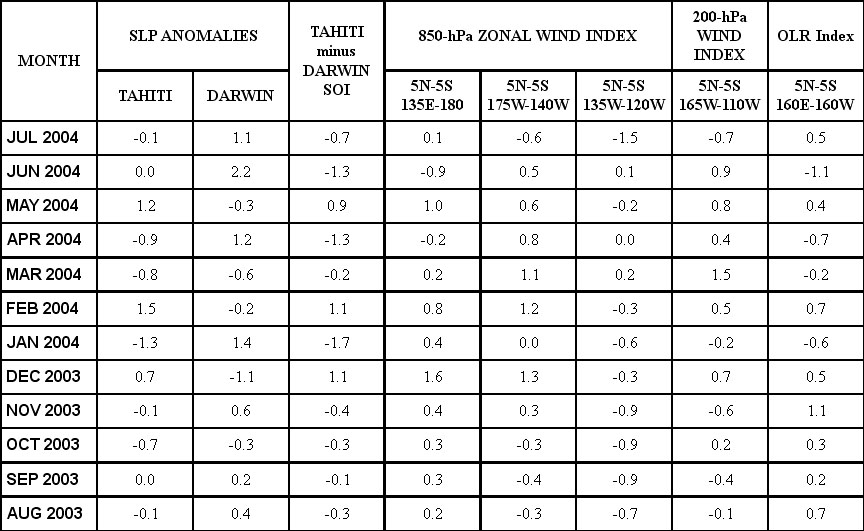
The monthly low-level (850-hPa) and upper-level (200-hPa)
equatorial zonal wind indices, the Tahiti-Darwin SOI and the outgoing
longwave radiation (OLR) index have all exhibited considerable variability
since November 2003 in association with intraseasonal activity (Table
T1). During July, low-level westerly wind anomalies (more than 3.0 m
s-1) were observed over the central equatorial Pacific (Fig.
T20), which resulted in the lowest value of the 850-hPa zonal wind
index in this region since June 2003 (Fig. T4).
The global Tropics featured near-normal convection during
July (Fig. T25). Across the eastern Pacific,
negative OLR anomalies near 15°N and positive anomalies near 10°N indicate
a northward shift of the ITCZ. MJO activity has contributed to increased
variability over the equator between 60°E and the date line since November
2003 (Fig. T11).
The Tahiti - Darwin SOI was -0.7 during July (Table
T1, Fig. T1), and the equatorial SOI
increased to 0.4 (Fig. T2). The Tahiti -
Darwin SOI has exhibited large month-to-month variability since November
2003, in response to MJO activity (Fig. T10),
although it has been negative during the past 2 months, in response to
higher than normal pressure over Darwin.


