Skip Navigation Links www.nws.noaa.gov 
NOAA logo - Click to go to the NOAA home page National Weather Service   NWS logo - Click to go to the NWS home page
Climate Prediction Center


CPC Search
 
HOME > Expert Assessments > Climate Diagnostics Bulletin  
 

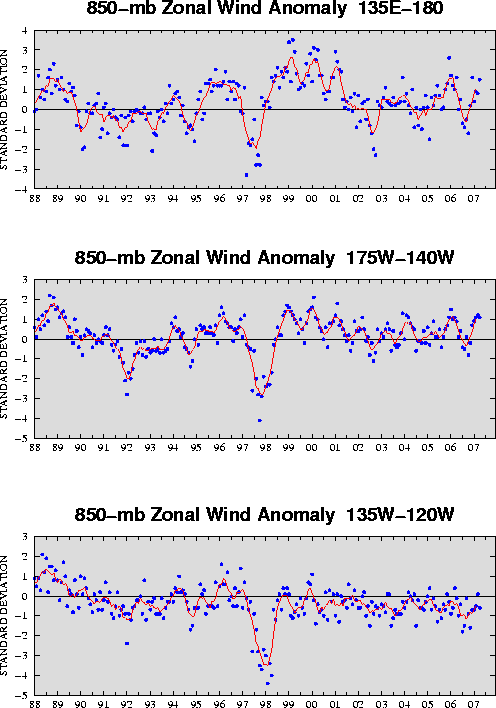
figure t4

FIGURE T4. Five-month running mean and individual monthly mean ("x"s) of the standardized 850-hPa zonal wind anomaly index in the latitude belt 5°N–5°S for 135°E–180° (top), 175°W–140°W (middle) and 135°W–120°W (bottom). Anomalies are departures from the 1979–95 base period means and are normalized by the mean annual standard deviation.The x-axis labels are centered on July. Positive (negative) values indicate easterly (westerly) anomalies.


NOAA/ National Weather Service
National Centers for Environmental Prediction
Climate Prediction Center
5200 Auth Road
Camp Springs, Maryland 20746
Climate Prediction Center Web Team
Disclaimer Privacy Notice