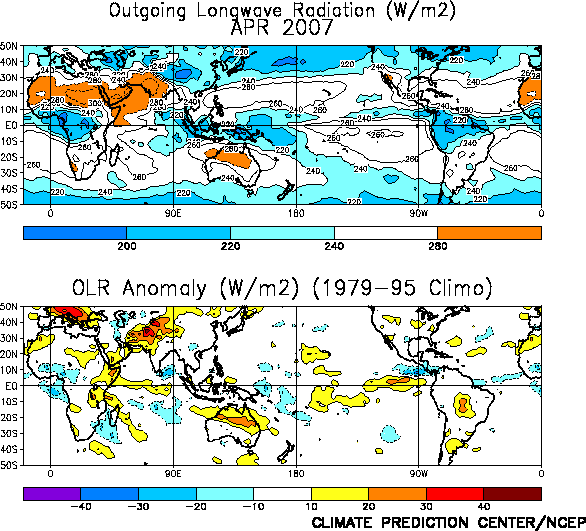
FIGURE T25. Mean (top) and anomalous
(bottom) outgoing longwave radiation (NOAA 18 AVHRR IR window
channel measurements by NESDIS/ORA). OLR contour interval is 20 Wm-2
with values greater than 280 Wm-2
indicated by dashed contours. Anomaly contour interval is 15 Wm-2
with positive values indicated by dashed contours and light shading.
Anomalies are departures from the 1979–95 base period monthly means.
|


