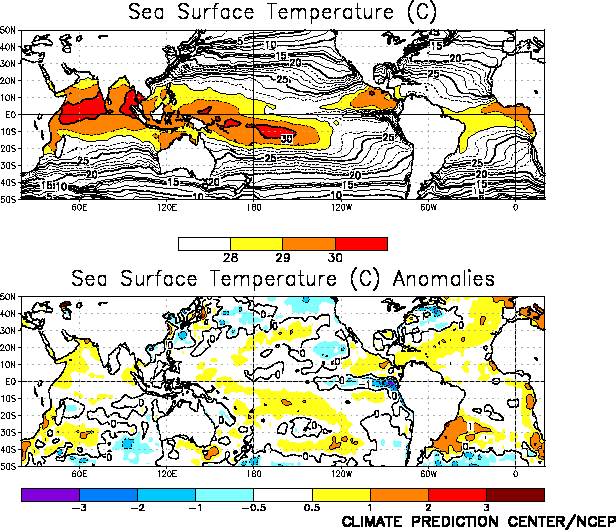
FIGURE T18. Mean (top) and anomalous
(bottom) sea surface temperature. Contour interval is 2°C (top) and
1°C (bottom). Temperatures >20°C are contoured every degree with
odd contours dashed in top panel. Dashed contours in bottom panel
indicate negative anomalies. SST anomalies are departures from the 1971–2000
base period means (Smith and Reynolds 1998, J. Climate, 11,
3320–3323).
|


