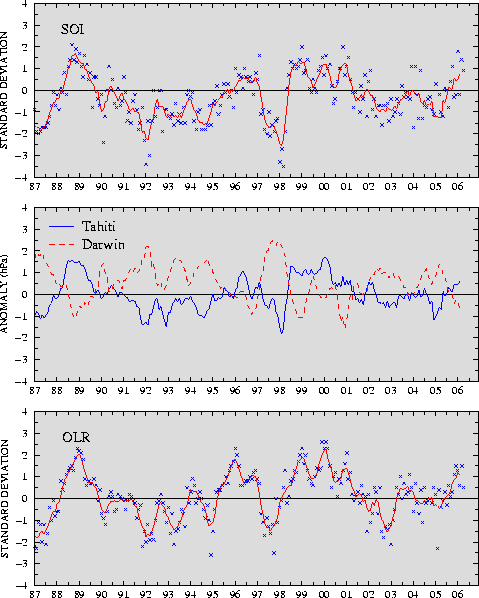
FIGURE T1. Five-month running mean of the
Southern Oscillation Index (SOI) (top), sea-level pressure anomaly (hPa)
at Darwin and Tahiti (middle), and outgoing longwave radiation anomaly (OLR)
index averaged over the area 5°N–5°S, 160°E–160°W (bottom).
Anomalies in the top and middle panels are departures from the 1951–80
base period means and are normalized by the mean annual standard
deviation. Anomalies in the bottom panel are departures from the 1979–95
base period means. Individual monthly values are indicated by "x"s
in the top and bottom panels. The x-axis labels are centered on July.
|


