Tropical Highlights - March 2004
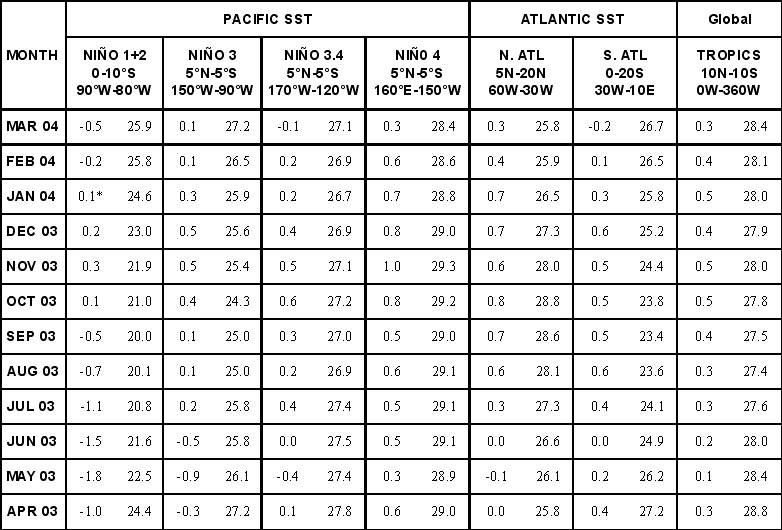
Sea surface temperature (SST) anomalies remained near-average across the
equatorial Pacific east of the date line and decreased to near-average in
the western Pacific during March 2004 (Fig. T18,
Table T2).
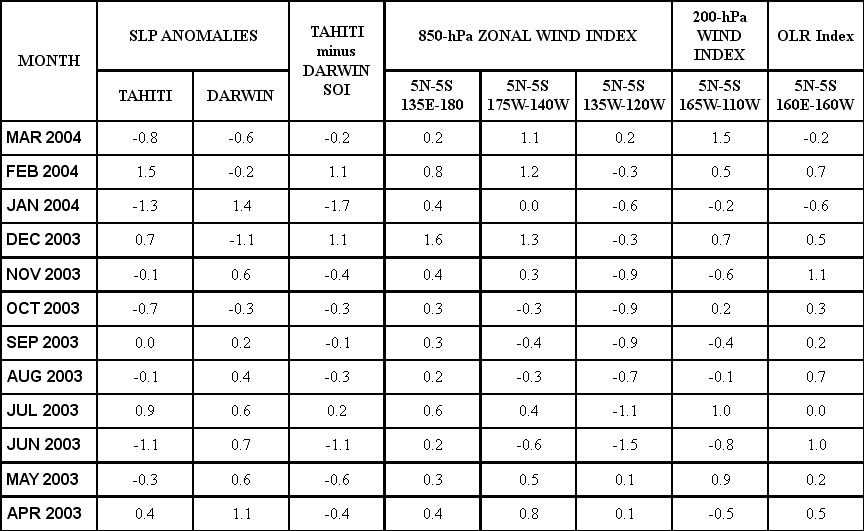
Atmospheric indices continued to exhibit large month-to-month variability
associated with intraseasonal (Madden-Julian Oscillations - MJO) activity (Figs.
T11, T12, T13, Table T1). Since November 2003, SST anomalies have
steadily decreased across the entire equatorial Pacific (Fig. T9),
with the values observed in Niño
1+2, Niño 3, and Niño
4 the lowest since September 2003 (Table T2).
The oceanic thermocline, measured by the depth of the 20°C
isotherm shoaled across most of the equatorial Pacific during the month,
with the thermocline remaining deeper than normal in the western and
west-central Pacific and shallower than normal in the eastern Pacific (Figs.
T15, T16). Consistent with these conditions, oceanic temperatures at
thermocline depth were 1-2°C above
average in the western and west-central equatorial Pacific and 2-3°C
below normal in the east-central and eastern Pacific (Fig. T17).
The monthly low-level (850-hPa) and upper-level (200-hPa) equatorial
zonal wind indices, the Tahiti-Darwin SOI and the outgoing longwave
radiation (OLR) index have all exhibited considerable variability since
November 2003 in association with intraseasonal activity (Table T1).
During March, stronger-than-average low-level easterly winds were observed
over the central Pacific (Fig. T20), while upper-level westerly winds
were stronger-than-average over the east-central Pacific, in association
with an anomalous subtropical cyclonic couplet straddling the equator near
120°W (Fig. T21). This
couplet also contributed to the largest value of the 200-hPa zonal wind
index since February 2002 (Fig. T3).
Tropical OLR anomalies were negative (enhanced cloudiness and
precipitation) over the western Pacific and Indonesia, and positive over the
central equatorial Indian Ocean and eastern equatorial Africa (Fig. T25).
Although convection over the central Pacific has exhibited increased
variability due to intraseasonal activity, there has been a tendency for
suppressed convection in this region since November 2003 (Fig. T11).
The Tahiti - Darwin SOI was -0.2 during March (Table
T1, Fig. T1).
This index has exhibited large month-to-month variability, in response to
strong MJO activity (Fig. T10). The equatorial SOI has exhibited less
variability during the past few months, although the index decreased to 0.0
during March, the smallest value since March 2003 (Fig. T2).


