The 500-hPa circulation
pattern during January featured above-average heights at high latitudes and
below-average heights in the subtropics and lower mid-latitudes (Fig. E9).
The main surface temperature departures during the month included
above-average temperatures over much of the
United States
, the high latitudes of the
North Atlantic
, northern
Europe
, and western
Russia
(Fig. E1). The main precipitation anomalies
reflected well above-average totals over the southwestern and midwestern
United States
(Figs. E3, E5, E6).
a.
United States
In the West and
Midwest
, extremely large precipitation totals (300%-400% above normal) began in
mid-December and continued through mid-January. During this period,
near-record warmth covered the South and East. These signals were the
primary contributor to the large monthly mean temperature anomalies (Fig.
E1) and precipitation departures (Figs. E3,
E5, E6) recorded during
January. These conditions were associated with a persistent large-scale
anomalous circulation that spanned the eastern North Pacific and
North America
(Fig. A2.1, top right). Regional aspects
of this pattern included a blocking ridge in the
Gulf of Alaska
, an amplified trough over the southwestern
U.S.
, both of which were centered 30°-40° longitude west of the
climatological ridge and trough positions. The
Hudson Bay
trough was notably weaker than average, as an upper-level ridge dominated
the eastern
U.S.
In the West, precipitation totals for the 30-day period 18
December -
17 January 2004
-05 reached 200+ mm across
California
and 75-150 mm across much of the Southwest and Inter-Mountain region. Most
of
California
, northern
Arizona
,
Utah
,
Nevada
, southern
Colorado
, and southern
Wyoming
recorded more than 400% of average precipitation during the period. January
marks the fifth straight month of above-average precipitation in the
Intermountain region, and the fourth straight month of above-average
precipitation in
Southern California
(Fig. E5). During January, this
above-average precipitation resulted from the amplified trough in the West,
along with a pronounced southward shift of the mean jet stream and storm
track (Figs. E10, T21).
This exceptionally focused storm track led to the same areas being hit by
several major, moisture-laden winter storms.
The Madden-Julian Oscillation (MJO) also contributed to the
enhanced precipitation in the West, through its impacts on the East Asian
jet stream and downstream circulation anomalies. This impact was seen in
mid-to-late December when the East Asian jet core and jet exit region were
retracted westward in response to enhanced MJO-related convection over the
equatorial
Indian Ocean
and suppressed convection near the date line (Figs. T11,
T12). These rainfall features led to a
pronounced westward shift of the mean upper-level ridge and trough
positions across the eastern North Pacific and North America, meaning that
the Southwest was situated downstream of a mean upper-level trough instead
of beneath the climatological mean ridge (Fig. A2.1
top right). As the enhanced convection associated with the MJO moved
eastward to the date line in early January, the East Asian jet stream
under-cut the blocking ridge and eventually extended all the way to
California
. This evolution contributed to the intensity and extended duration of
precipitation in the Southwest in early January.
In the
Midwest
, precipitation totals during 18 December -
17 January 2004
-05 reached 150+ mm (200%-400% of average) from
Arkansas
and
Missouri
northeastward to
Pennsylvania
. Nearly all of this precipitation resulted from major storms that occurred
on 23 December, and 2-6 and 11-13 January. During the first storm all of
the precipitation fell as snow, with accumulations of 10-20 inches recorded
throughout the
Ohio
Valley
region. The second and third storms occurred during a major warm-up in
early January. The excessive rainfall from these storms, combined with
rapid snowmelt, produced significant flooding from northeastern
Oklahoma
to
Pennsylvania
.
These winter storms were embedded within a persistent jet
stream that extended northeastward from the central
Baja
Peninsula
to
New England
. Each storm was associated with strong frontal boundaries and deep
northward flow of moisture from the
Gulf of Mexico
, which contributed substantially to the extreme nature of the
precipitation events.
b.
North Atlantic
and
Europe
Above-average 500-hPa
heights were again observed across the high latitudes of the
North Atlantic
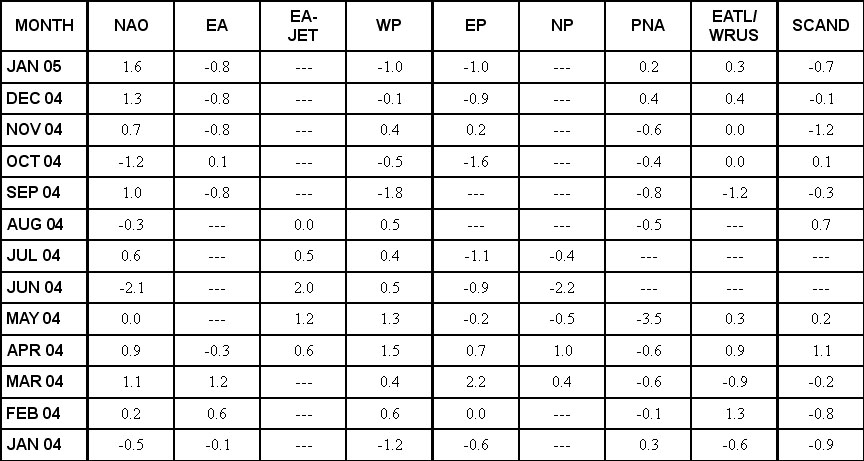
during January (Fig. E9). This pattern
reflected a strong positive phase (+1.6) of the North Atlantic Oscillation
(NAO) (Table E1, Fig. E7),
and has prevailed in four of the last five months. These conditions were
associated with an enhanced flow of marine air into northern
Europe
and
Scandinavia
, which contributed to ongoing above-average temperatures in these areas (Fig.
E10). The
North Atlantic
also saw a continuation of exceptionally warm SSTs at both high latitudes
and in the subtropics. This warmth reflects the ongoing warm phase of the
Atlantic multi-decadal mode that began approximately in 1995 (Goldenberg et
al. Science, 2001).
2. Southern Hemisphere
The 500-hPa circulation pattern during January featured
persistent positive 500-hPa height anomalies over the central Indian Ocean,
in the area south of Africa, and over the central subtropical South Pacific,
and below-average heights over the high latitudes of the central South
Pacific and in the area south of South America. This overall anomaly pattern
had little impact on the surface temperature (Fig. E1)
and precipitation (Fig. E3) patterns over
South America
and
Australia
, which generally recorded near-average conditions during the month.


