Tropical Highlights - January
2004
Surface and sub-surface oceanic conditions across the Tropical Pacific
remained slightly warmer than average during January 2004 (Table T2),
while atmospheric indices have featured increased variability associated
with strong intraseasonal (Madden-Julian Oscillations - MJO) activity (Figs.
T11, T12, T13, Table T1). Although sea surface temperature (SST)
anomalies remained above average across the entire equatorial Pacific, the
departures across the tropical Pacific decreased slightly from December (Table
T2, Fig. T5). The largest SST departures (exceeding 1°C)
remained in the western Pacific between 160°E
and the date line (Fig. T18).
The strong MJO activity during December and January was instrumental in
initiating an eastward-propagating oceanic Kelvin wave, which has resulted
in an eastward shift of positive sub-surface temperature anomalies (Fig.
T17) (deeper-than-average thermocline depths, Fig. T15).
Consistent with these conditions, oceanic temperatures at thermocline depth
increased to 2-3°C above average in
the west-central equatorial Pacific (Fig. T17).
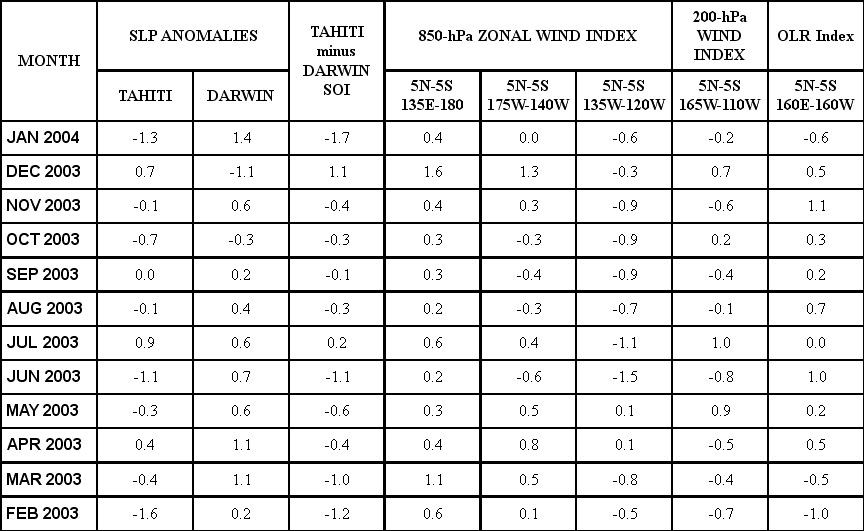
The low-level (850-hPa) and upper-level (200-hPa) equatorial winds were
near-normal across the Pacific during January (Table
T1, Figs. T20, T21).
Tropical outgoing longwave radiation (OLR) anomalies were negative (enhanced
cloudiness and precipitation) over the central Pacific between the equator
and 10°S, equatorial Africa and
northeastern Brazil and positive over the eastern Indian Ocean and Indonesia
(Fig. T25). The pattern of convection over the western and central
Pacific represents an eastward shift of the South Pacific Convergence Zone,
while the enhanced convection over northeastern Brazil was associated with
well-above normal precipitation (Figs. E3, E4). Both tropical
convection and the low-level winds continued to be influenced by MJO
activity (Figs. T11, T12).
The Tahiti-Darwin SOI was -1.7 during the January, the largest negative
value of this index since April 1998 (Table T1, Fig. T1). This index
has exhibited large week-to-week variability since late November, in
response to strong MJO activity (Fig. T10). The equatorial SOI has
exhibited less variability during the past few months, with the index
remaining near 0.5 since November 2003 (Fig. T2).


