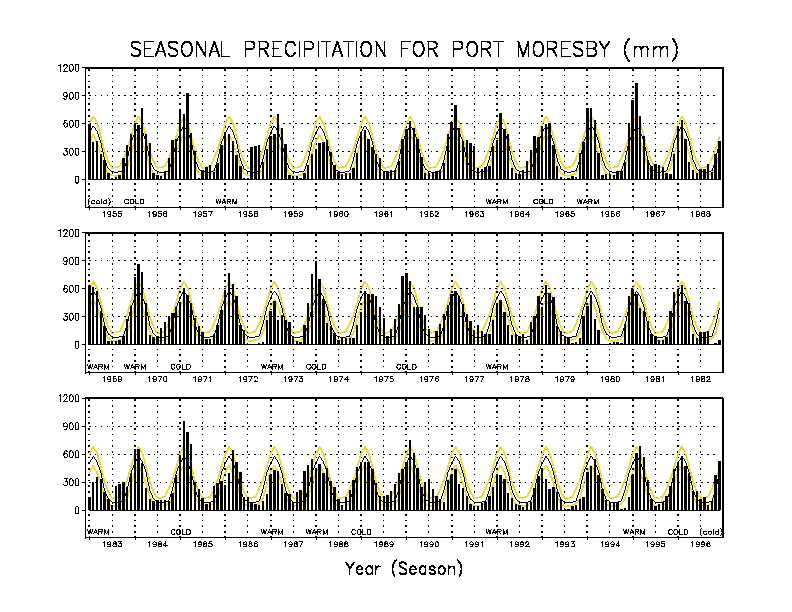
Histogram of the raw rainfall (mm) amount for running 3-month periods in chronological
order from 1955 through 1996. The seasonal cycle of the quartile boundaries (25 %ile: lower light line; 50 %ile [i.e., median]: dark line; and 75 %ile:
upper light line) are plotted with the actual rainfall amounts for the given period/year (vertical bars).
The year labels shown on the horizonal axis are placed at the center of the calendar years rather than at Dec-Jan-Feb, with the latter
denoted by tick marks.
The ENSO status of each boreal winter is shown underneath the main panels of the histogram. Boreal winters that are split between two rows of the
histogram (i.e., 1968-69 and 1982-83) have their ENSO status indicated in both rows.


