Wesley Ebisuzaki and Muthuvel Chelliah
Climate Prediction Center, NCEP
Studying decadal-scale variability appears possible with the NCEP/NCAR Reanalysis as it covers over 50 years (1948-1998+). However, changes in the observational network can add spurious low-frequency variability to the analyses which could then be confused with a decadal variability. In this study, we look at the low-frequency behavior of the means as well as the high frequency (periods shorter than 7 days) variance. Since any real change in the basic state flow must alter the high-frequency variance, we can then look at the data to see if the time-means and high-frequency variance are consistent with each other. This provides a test for spurious low-frequency signals.
In this preliminary study, we used NCEP/NCAR Reanalysis data to examine the decadal variability of the basic-state anomalies (500 mb heights, 200 mb winds) and high-frequency variance (500 mb heights, sea-level pressure). The high-frequency variance was calculated from 00Z/12Z data which had been high-passed filtered. Significance tests were performed using a bootstrap technique.
The consistency of the high-frequency variance with respect to the basic-state flow is not a solved problem. Observations suggest that the storm tracks are related to the jets and are often strongest downstream of large-scale troughs. One explanation comes from the normal-model instabilities of a wavy baroclinic basic state. While the transients are not normal modes, the spatial structure of these modes are suggestive of observed storm tracks (Frederiksen). This is not surprising as the observed transients are baroclinically active and over the long haul sustain themselves through the same mechanism that supports the normal-mode instabilities. While Frederiksen only showed the instability of a limited number of basic states, one can infer how some of the the patterns may change using the results of Ebisuzaki (1989).
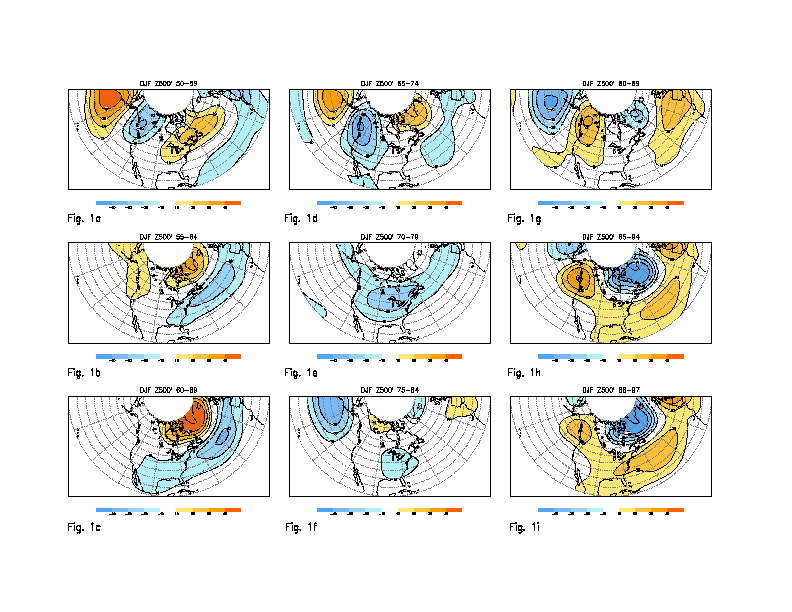
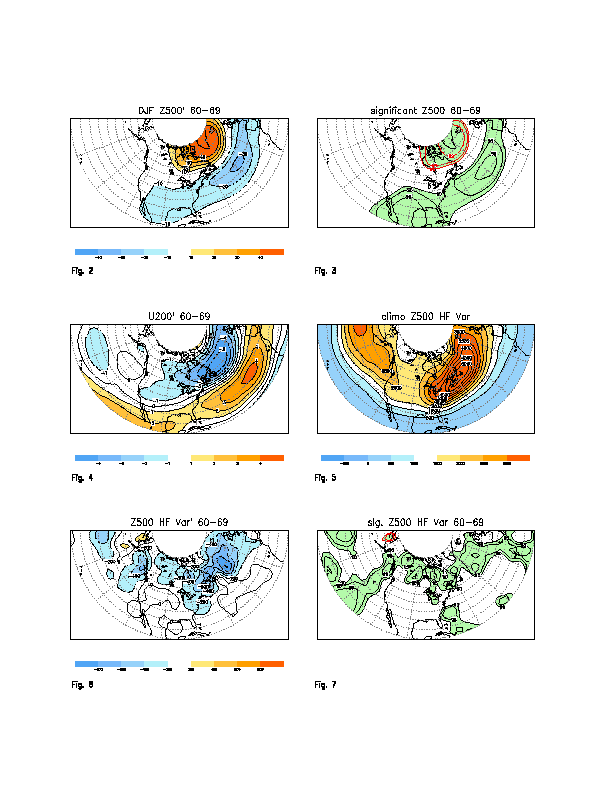
Figs. 1a-1i show the evolution of the decadal means of DJF 500 mb height anomalies. The most prominent feature is the variability of the North Atlantic Oscillation (NAO). The next six figures illustrate the details for 1960's. Fig. 2 and 3 shows the 500 mb height anomalies as well as 99\% local significance. The 200 mb winds (Fig. 4) shows a more zonal mid-latitude Atlantic jet. This change in the basic state should shift the climatological Atlantic storm track (Fig. 5) southward. In addition, the reduction in the baroclinicity as suggested by Fig. 3 should reduce the strength of the HF variance south of Greenland.. This is consistent with the observed HF variance (Figs. 6 and 7). Since the low-frequency and high-frequency variance appear consistent, we are more comfortable in accepting the 60's NAO signal as real rather than an artifact of a changing observation system.
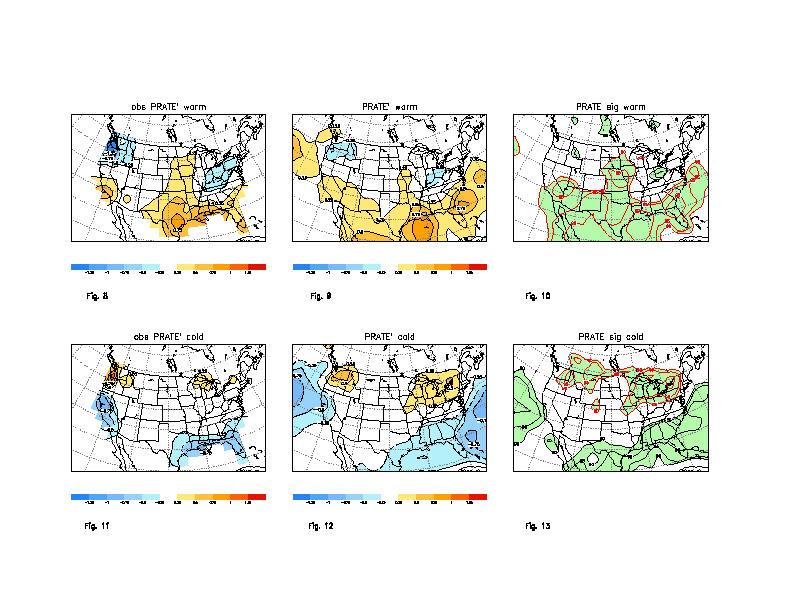
Another aspect of the high-frequency variability is the wintertime mid-latitude precipitation which is generally caused by transient eddies. Rather than compare Reanalysis precipitation with theoretical expectations, we compared it with observed US gauge measurements (Higgins). We also changed the focus from decadal variations to warm and cold ENSO events, another low-frequency signal. Fig. 9 shows the anomalous reanalysis DJF precipitation along with its significance (Fig. 10). This compares favorably with the anomalous gauge precipitation (Fig. 8). Figs. 12, 13 and 11 are the corresponding figures for the cold events. Like for the warm events, the Reanalysis precipitation anomalies compares favorably with observations.
In summary, one can study the low frequency variability using NCEP/NCAR Reanalysis. However, one must be concerned about studying a spurious signal caused by the changes in the observational network. One necessary condition for a genuine signal is that the high-frequency variance change consistently with changes in the basic state. While a consistent change does not confirm that the low-frequency signal is real, it does add supporting evidence.