|
Most Recent Week-1 and Week-2 Verification
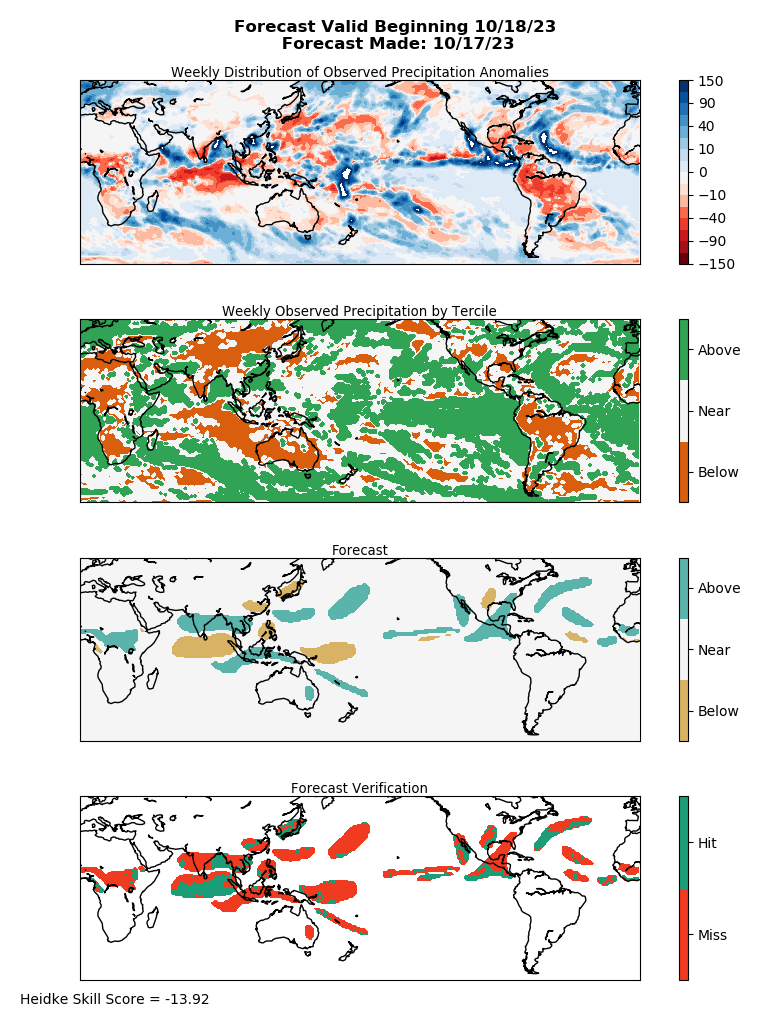
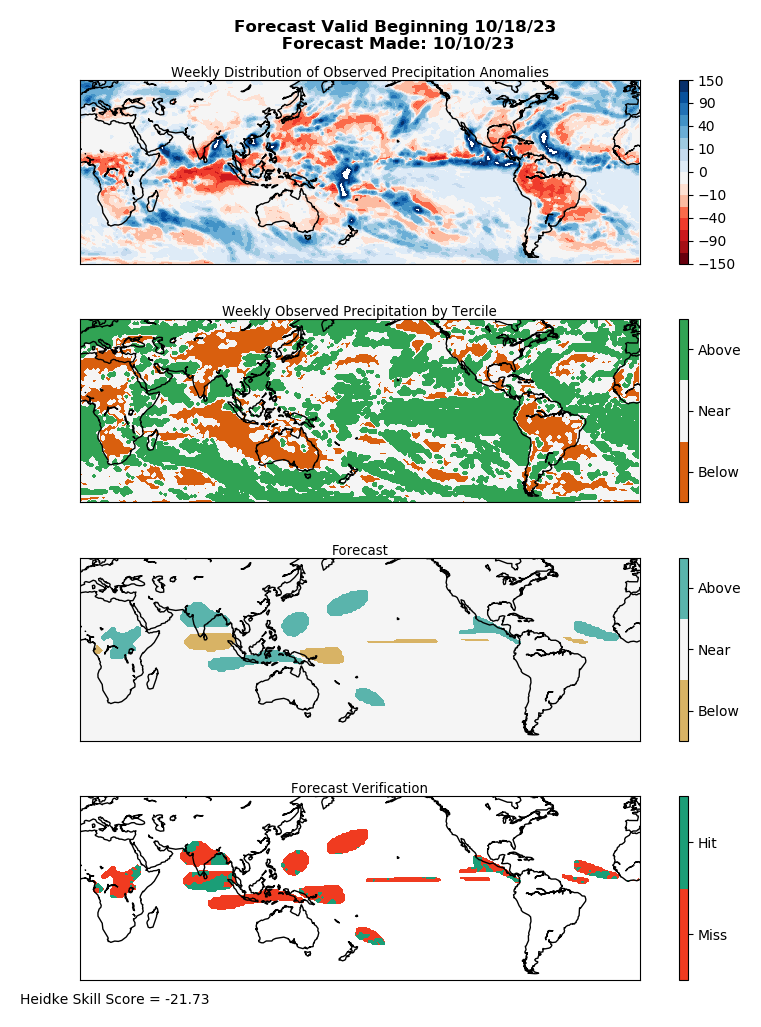
The four panel plots below show verification for the most recent Week-1 (left) and Week-2 (right) forecasts available. These plots are updated weekly, using a verifying period of 0000 UTC Wednesday through 2359 UTC the following Tuesday. Verification is based on the CPC Unified Precipitation Dataset, which uses both gauge and satellite observations to create a grid of daily precipitation totals over the globe from 60S to 60N.
The first two plots show the observed precipitation over the 7 day period. The top plot is anomalous rainfall and the second shows the precipitation categorized into terciles: above (>66%), near (33-65%) and below (<33%) normal. Climatology is based on 2003-2015 observations from the CPC Unified Precipitation Dataset. The third plot is the forecast for the week-1 or week-2 period, while the bottom plot shows spatial verification of that forecast compared to the tercile categorization of the precipitation. Below the plots is the heidke skill score of the 7-day forecast.
Longterm Rainfall Area Verification
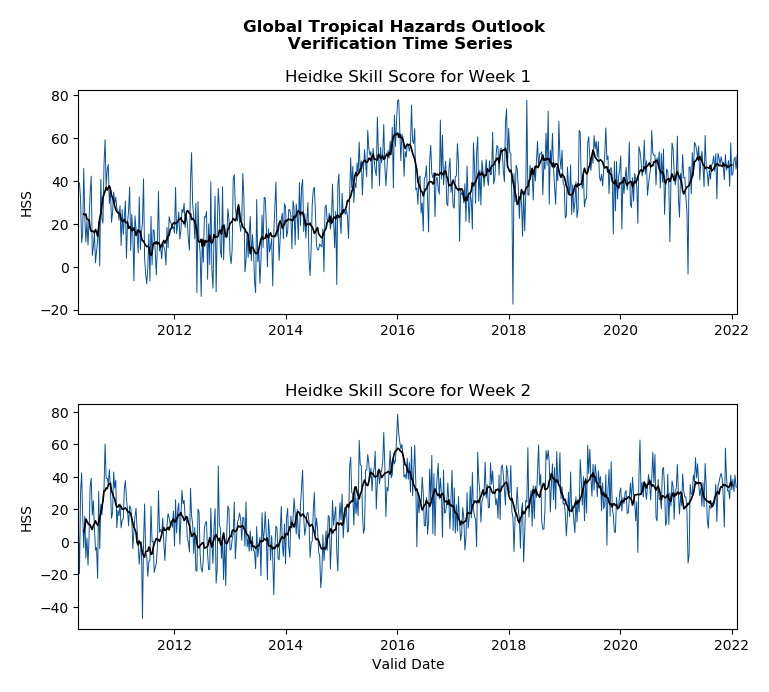
The Global Tropics Hazard Outlook was first issued starting in early 2010. Below is a time series of the heidke skill scores for the week-1 and week-2 periods from March 2010 until present. The black line on each of the plots represents a 3-month moving average of the HSS.
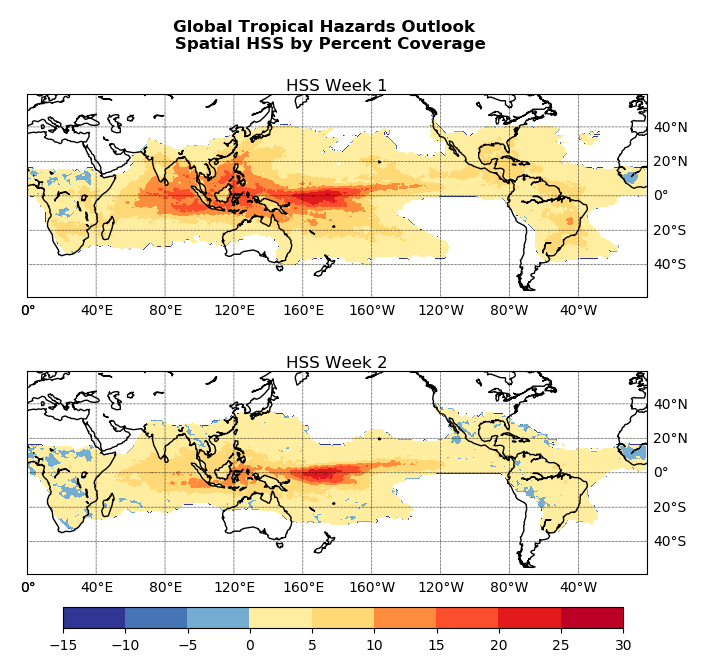
The spatial heidke skill score plot is weighted by percent coverage of forecasts throughout the entire history of the outlook. This helps indicate areas with high predictability that are also most frequently forecasted for.
Appendix
Heidke Skill Score Calculation:
The Heidke skill score (HSS) is a hit-based skill score and is calculated through the following relationship that compares the number of correct and incorrect hits along with the number of expected hits from random chance:
HSS (%) = 100 * (H - E) / (T - E)
where H = Number of correct forecasts, E = Expected number of correct forecasts (1/3 of total), and T = total number of forecasts.
The HSS is a measure of how well a forecast did relative to a randomly selected forecast. A score of 0 means that the forecast did no better than what would be expected by chance. A score of 100 depicts a "perfect" forecast and a score of -50 depicts the "worst possible" forecast. The second set of time series plots are obtained by simply multiplying the forecast coverage by the above skill score value which weights more heavily outlooks with greater forecast coverage.
|